


Boston's condominium market is constantly evolving, with shifts in pricing, sales activity, and buyer demand shaping the landscape each quarter.
In our Q3 2026 Boston Condominium Market Report, we take a closer look at the latest sales data, comparing performance with the same period in 2025 and examining trends over the past five years. From transaction volume and average sale prices to days on market and sale-to-list price ratios, this report provides a comprehensive look at Boston's condominium market during the third quarter of 2026.
Summary
Boston's condominium market continued to demonstrate pricing strength in the third quarter of 2026, even as overall transaction volume declined slightly and properties spent more time on the market.
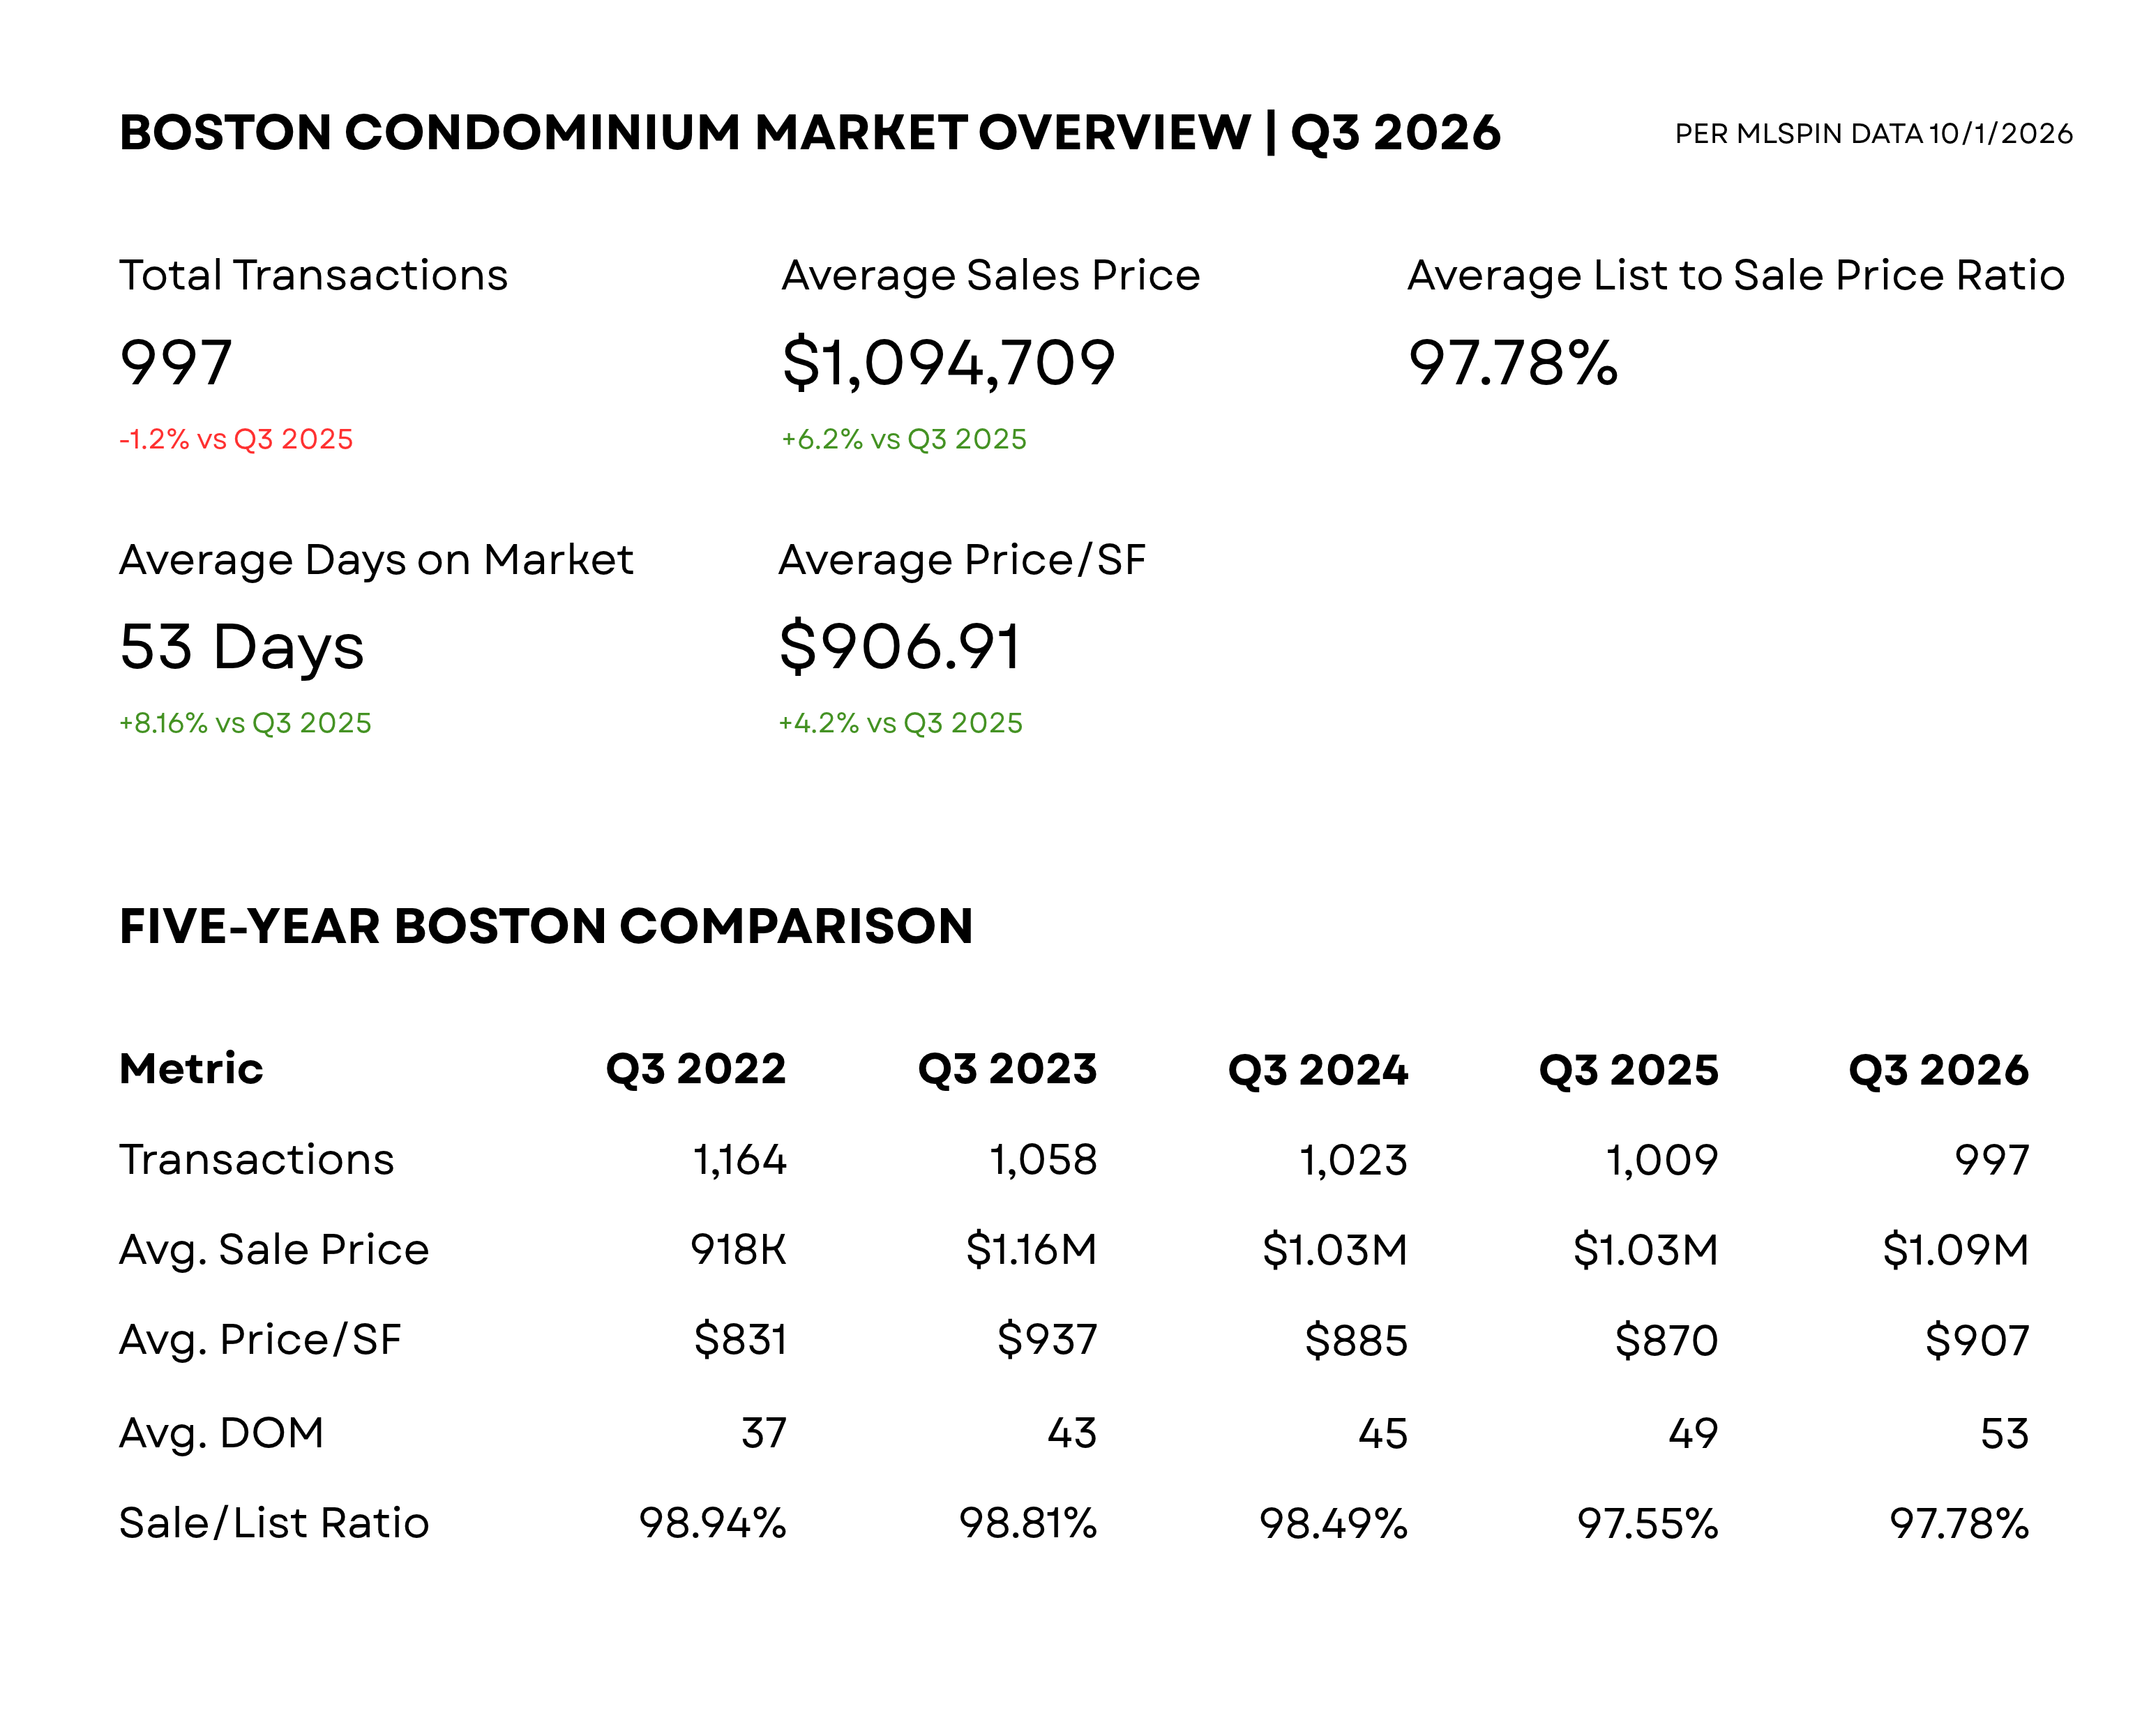
A total of 997 condominiums sold during the quarter, compared with 1,009 during Q3 2025, representing a 1.2% decrease. While sales volume remained relatively stable year over year, the five-year trend reveals a gradual decline in quarterly transactions, down approximately 14.3% from Q3 2022.
Despite fewer transactions, the average condominium sale price increased 6.2% year over year to approximately $1.09 million. Average price per square foot also rose 4.2% to $906.91, indicating that the increase in average sale price was accompanied by higher pricing on a per-square-foot basis.
Properties spent an average of 53 days on the market, compared with 49 days a year earlier. This continues a five-year pattern of gradually lengthening marketing times, suggesting that buyers may be taking a more measured approach to purchasing decisions.
The average sale-to-list price ratio improved modestly to 97.78%, up from 97.55% in Q3 2025. While properties generally sold below their asking prices, the slight improvement suggests that sellers who priced competitively were still able to achieve results relatively close to their expectations.
The overall takeaway: Boston's condominium market remained resilient in Q3 2026, but higher prices did not necessarily translate into faster sales. Neighborhood-level performance, property condition, and pricing strategy continued to play important roles in transaction outcomes.
Neighborhood performance highlights
A few neighborhoods stand out when looking at pricing, transaction activity, and buyer demand together.
Beacon Hill — Significant Price Appreciation
Average sale prices increased 44.7%, price per square foot rose 11.6%, and transactions increased 44.8%. However, longer marketing times and a lower sale-to-list ratio suggest that the increase in pricing did not translate into stronger negotiating conditions for every seller.
Charlestown — Balanced Market Strength
Average prices increased 2.3%, price per square foot rose 5.1%, and properties sold eight days faster than a year earlier. With a 99.6% sale-to-list ratio, Charlestown demonstrated comparatively strong demand and pricing stability.
Dorchester — Broad-Based Pricing Growth
Average sale prices increased 10.4%, price per square foot rose 5.0%, and marketing times shortened slightly. Although transaction volume declined, pricing metrics suggest continued strength among properties that sold.
Explore Boston's Neighborhood Markets
Boston's real estate market varies from neighborhood to neighborhood. For a closer look at Q3 2026 condominium sales, pricing trends, and market activity across 21 Boston neighborhoods, explore our full neighborhood-by-neighborhood analysis.
Read the Q3 2026 Neighborhood Market Reports →
Thinking about buying or selling in Boston? Connect with The Charles Realty for a personalized market analysis and guidance on your next move.

Social Links Footer