


While Boston's condominium market experienced rising prices and slightly slower sales activity overall in Q3 2026, market conditions varied significantly across the city's neighborhoods.
To better understand these differences, we've analyzed condominium sales activity across 21 Boston neighborhoods, comparing Q3 2026 performance with the same period in 2025 and examining trends over the past five years. Each neighborhood breakdown highlights changes in transaction volume, average sale price, price per square foot, days on market, and sale-to-list price ratios.
Explore the neighborhood summaries below for a closer look at how Boston's individual condominium markets performed during the third quarter of 2026.
Allston
Allston recorded 12 condominium transactions, up from nine a year earlier. Despite the increase in sales activity, the average sale price declined 24.1% to approximately $450,000, while average price per square foot fell 6.3%. Properties spent an average of 81 days on the market, compared with 66 days in Q3 2025. With a relatively small number of transactions, changes in the mix of properties sold may have contributed to the pricing decline.
Back Bay
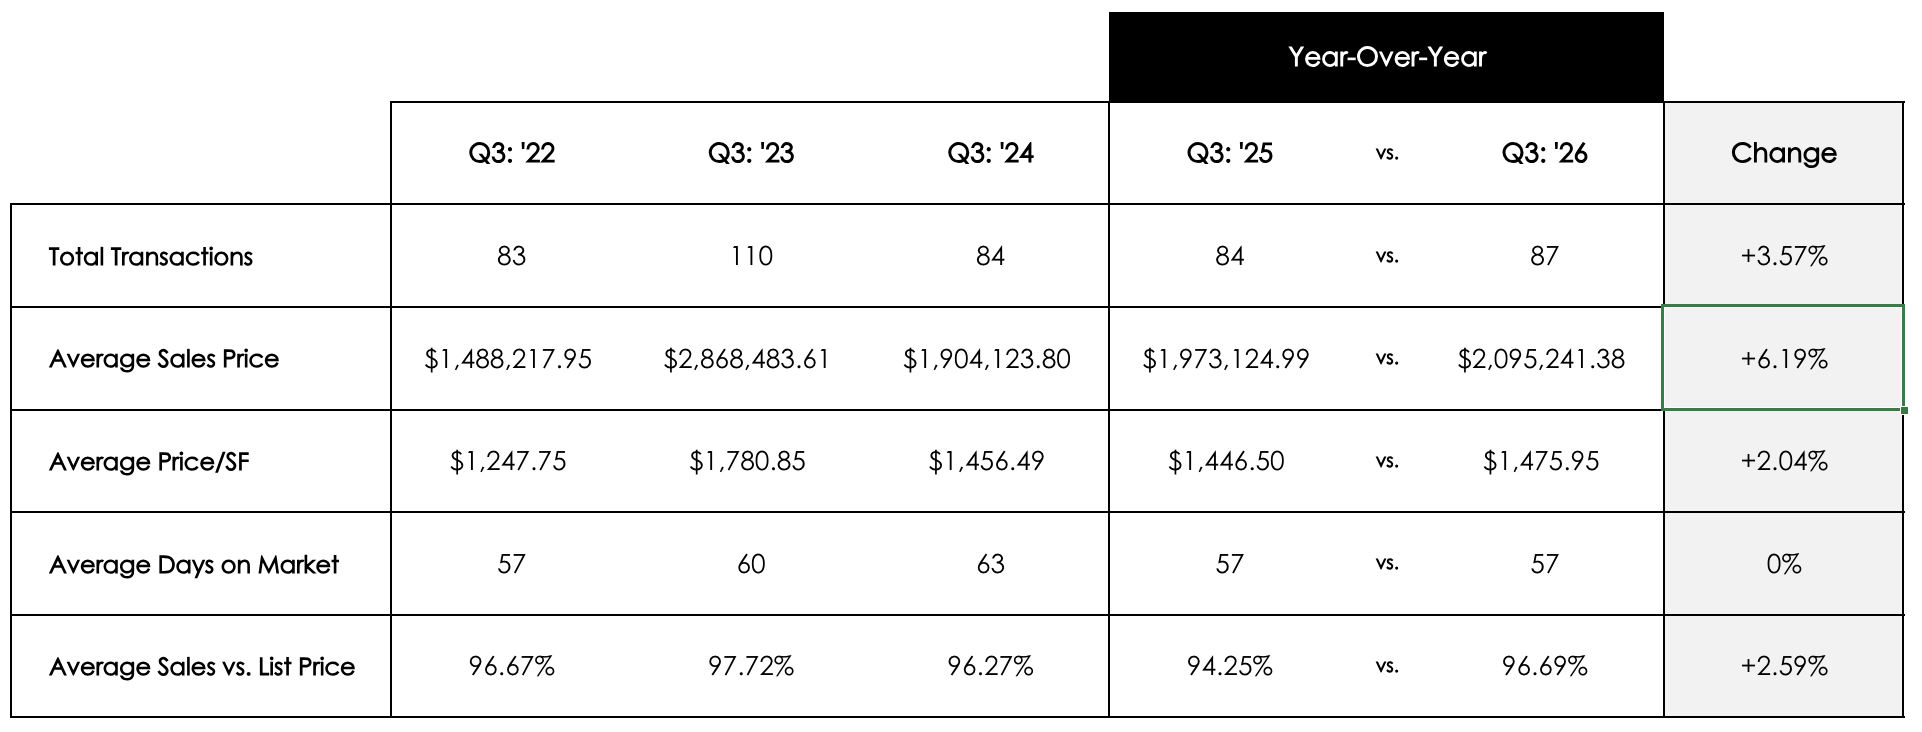
Back Bay's condominium market demonstrated continued pricing strength, with the average sale price increasing 6.2% to approximately $2.10 million. Average price per square foot rose 2.0% to $1,475.95, while transaction volume increased modestly to 87 sales. Average days on market remained unchanged at 57, and the sale-to-list ratio improved to 96.69%. These results suggest relatively stable activity within one of Boston's higher-priced condominium markets.
Bay Village
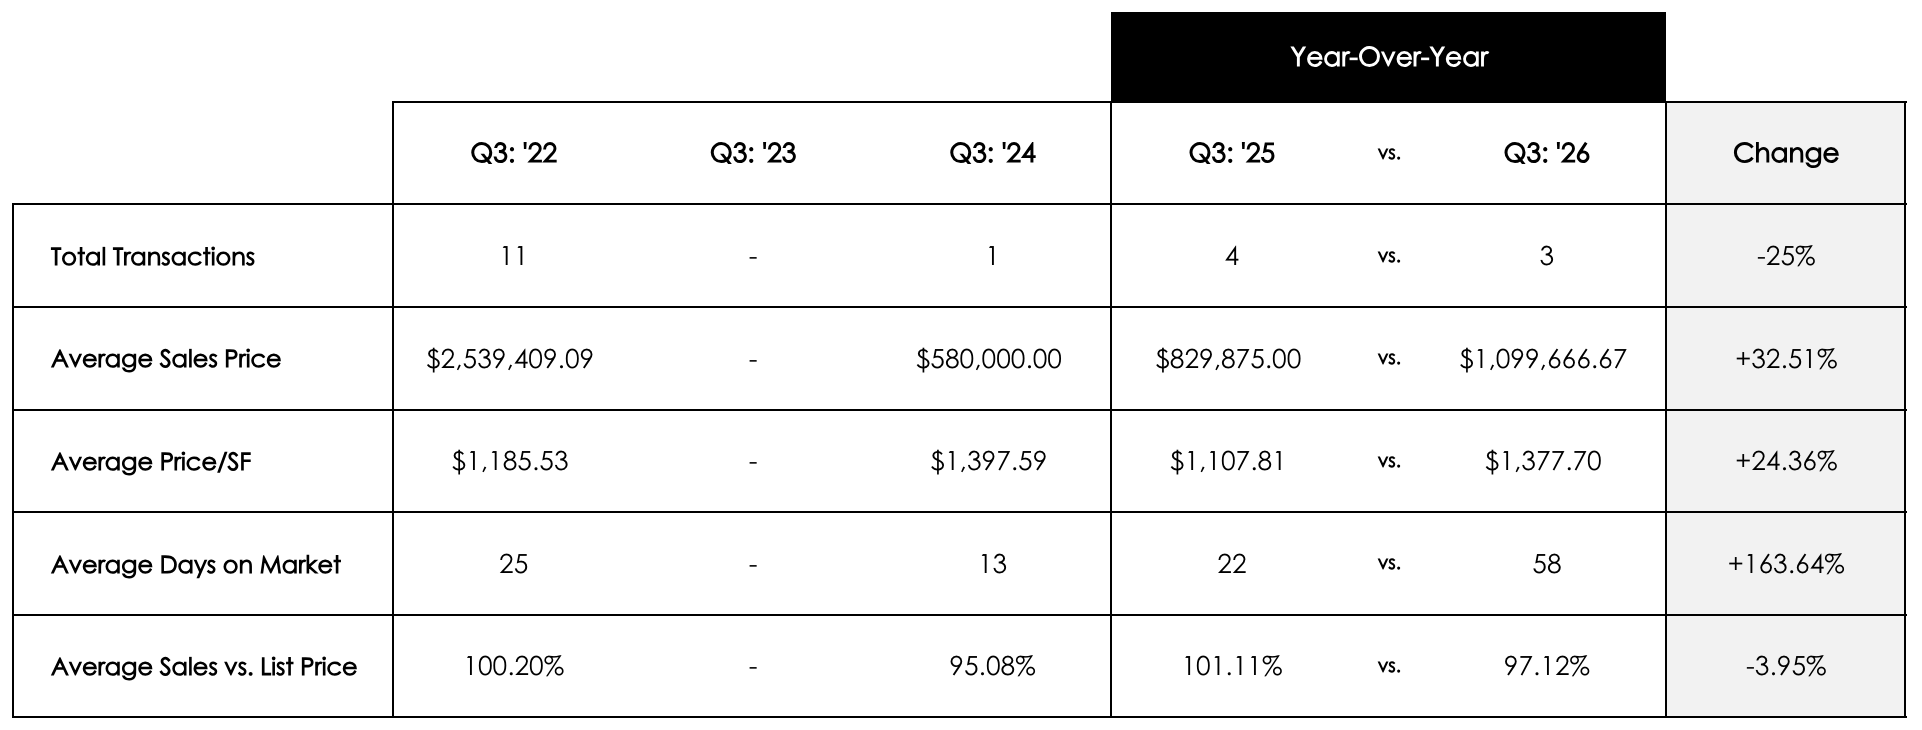
Bay Village recorded just three condominium transactions during Q3 2026, compared with four in the prior year. The average sale price increased 32.5% to approximately $1.10 million, while price per square foot rose 24.4%. However, average marketing time increased to 58 days, and the sale-to-list ratio declined to 97.12%. Given the extremely limited number of sales, these changes should be interpreted cautiously.
Beacon Hill
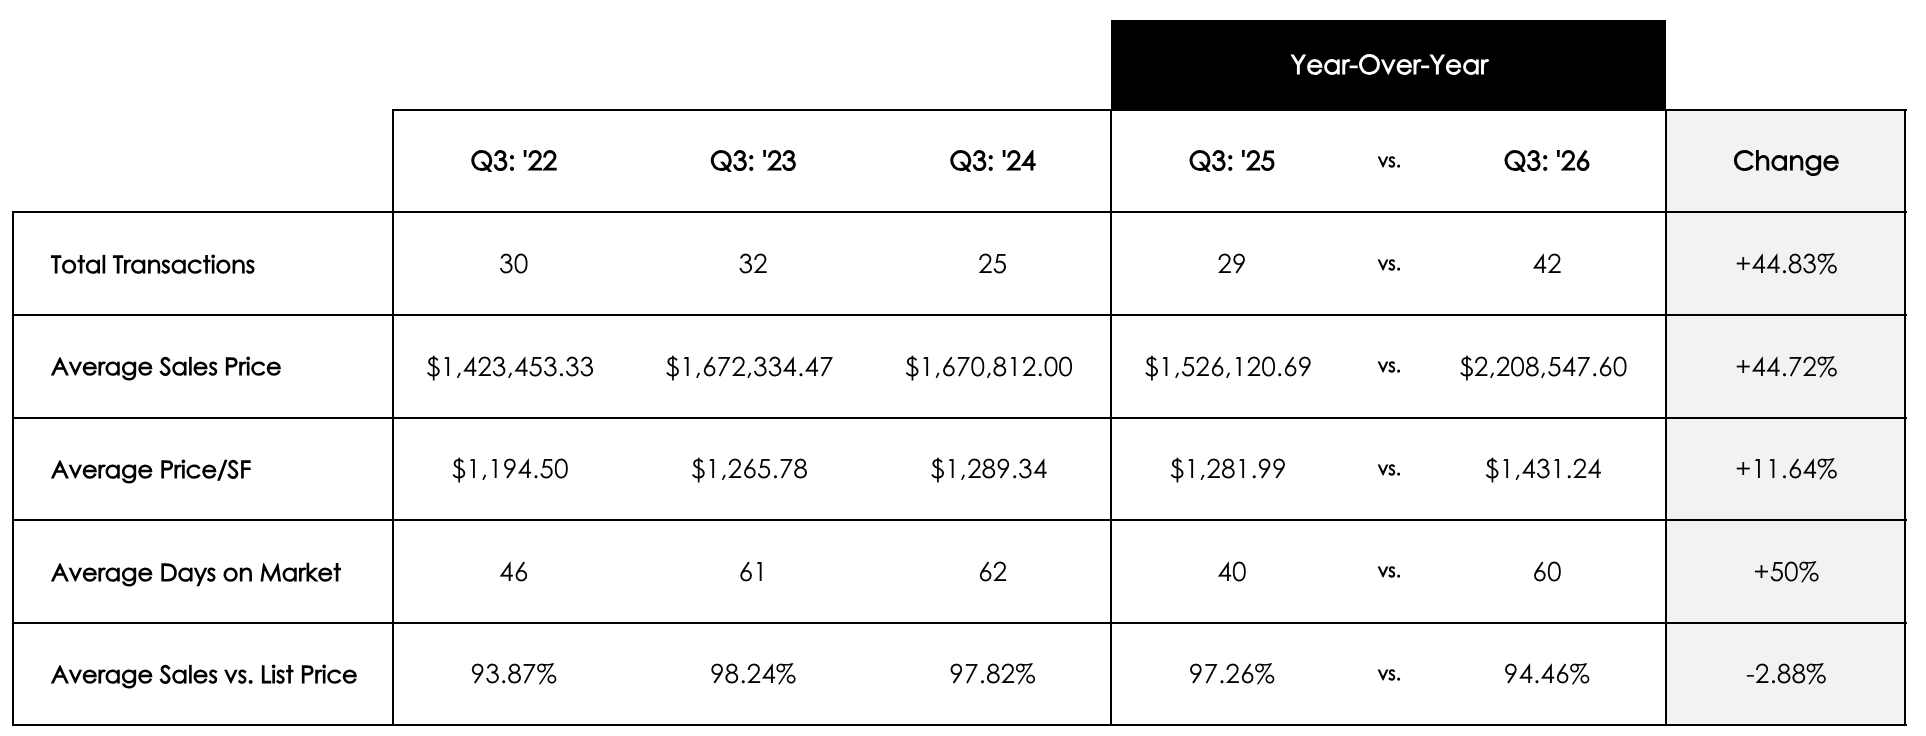
Beacon Hill experienced one of the most notable increases in average condominium pricing during Q3 2026. The average sale price rose 44.7% to approximately $2.21 million, while price per square foot increased 11.6% to $1,431.24. Transaction volume also increased substantially, reaching 42 sales compared with 29 in Q3 2025. However, average days on market increased from 40 to 60, and the sale-to-list ratio declined to 94.46%, suggesting that sellers continued to face meaningful price negotiations.
Brighton
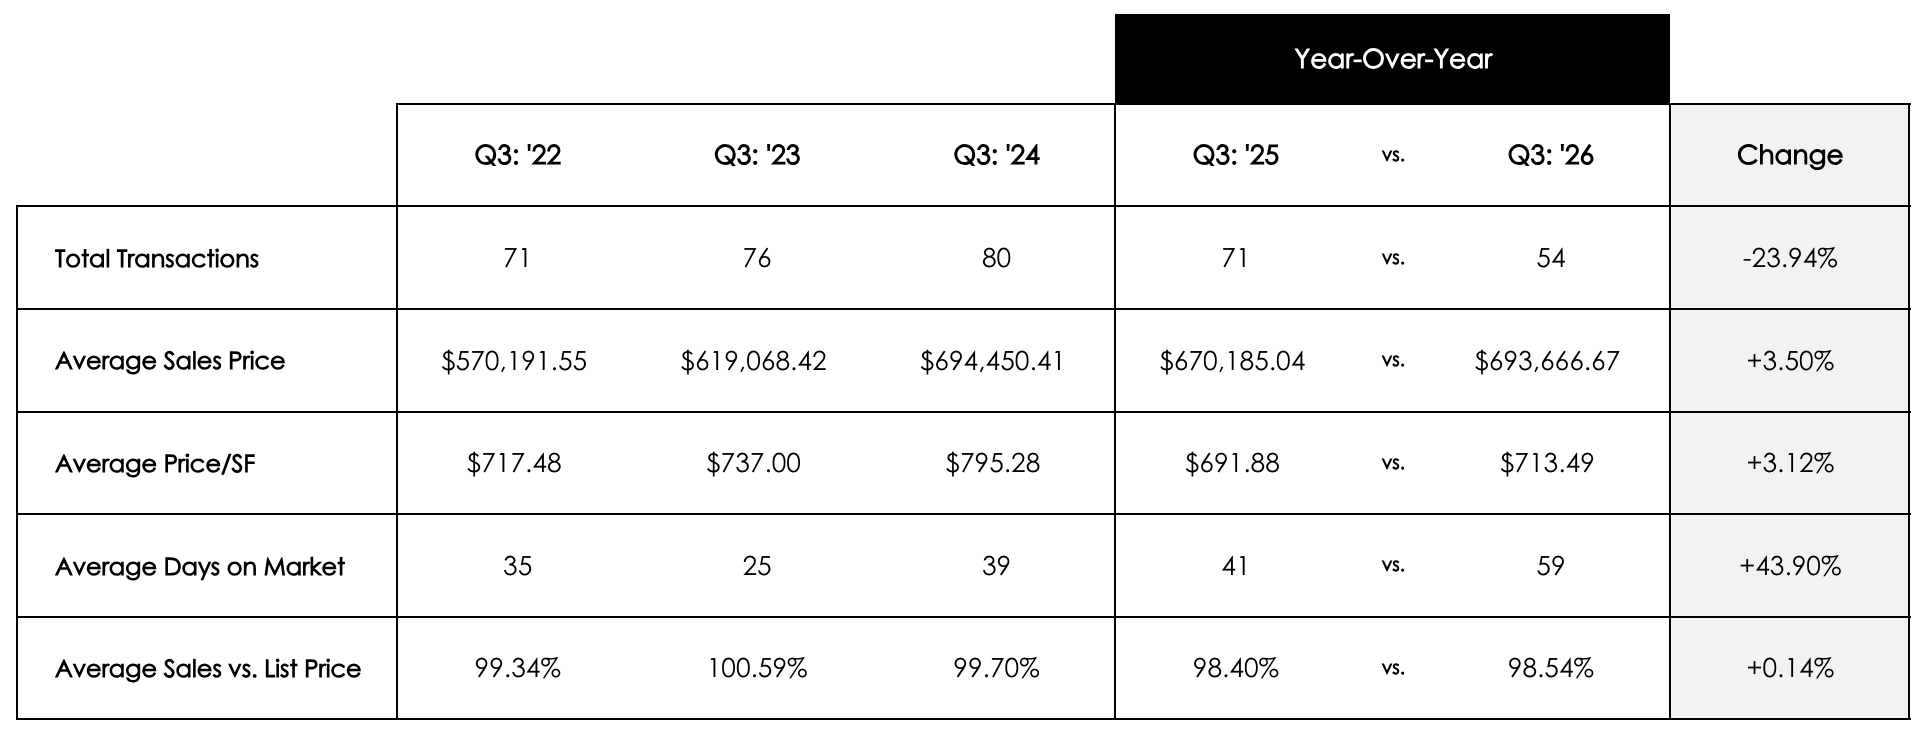
Brighton's condominium market experienced lower transaction volume, with 54 sales compared with 71 during Q3 2025. Average sale prices nevertheless increased 3.5% to approximately $694,000, while price per square foot rose 3.1%. Properties spent an average of 59 days on the market, up from 41 days a year earlier. The results suggest modest pricing resilience alongside a slower pace of sales.
Charlestown
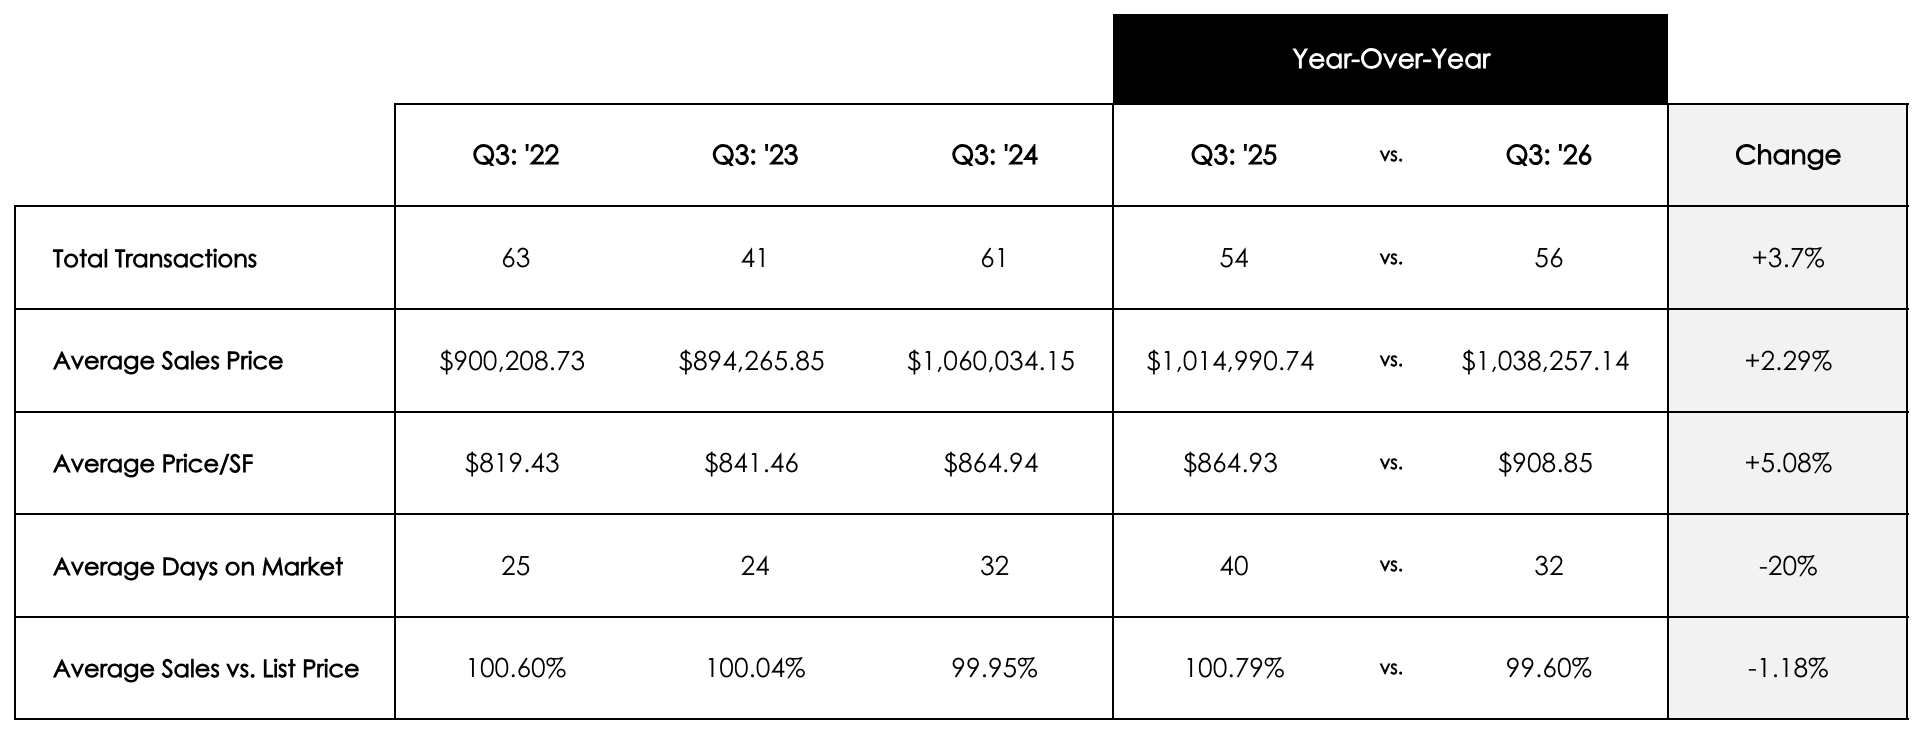
Charlestown delivered a comparatively balanced performance in Q3 2026. Average condominium prices increased 2.3% to approximately $1.04 million, while price per square foot rose 5.1%. Transaction volume increased slightly to 56 sales, and average marketing time decreased from 40 to 32 days. With properties selling at an average of 99.6% of asking price, Charlestown showed encouraging signs of sustained buyer demand.
Dorchester
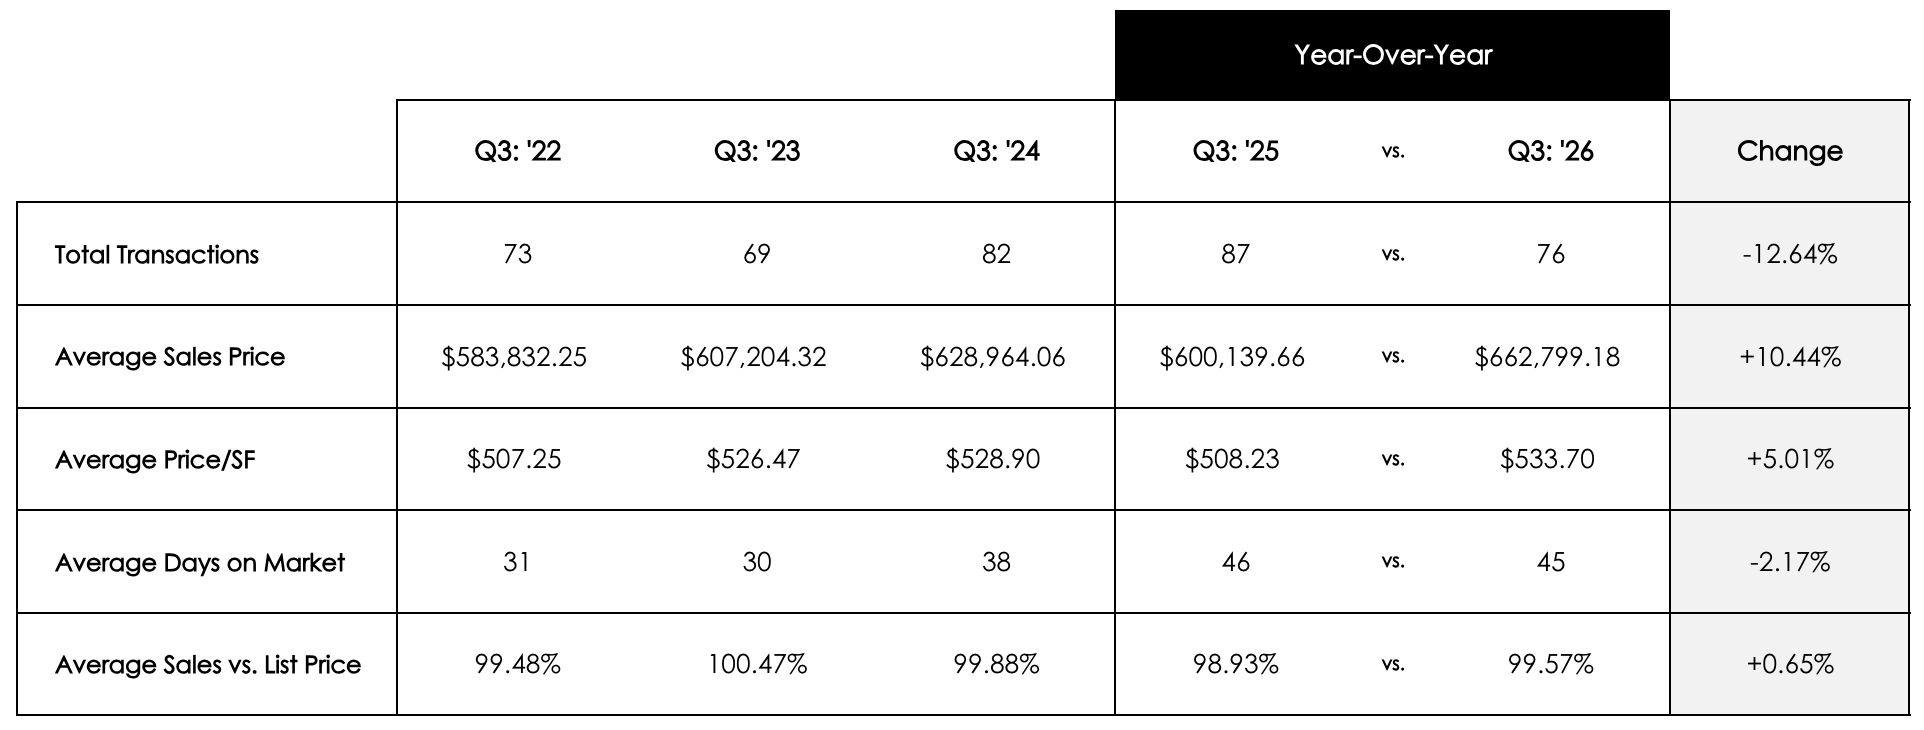
Dorchester recorded 76 condominium sales during Q3 2026, down from 87 in the prior year. Despite fewer transactions, the average sale price increased 10.4% to approximately $663,000, and average price per square foot rose 5.0%. Properties sold in an average of 45 days, one day faster than in Q3 2025, while the sale-to-list ratio reached approximately 99.6%. Overall, the data points to resilient pricing and relatively steady demand.
East Boston
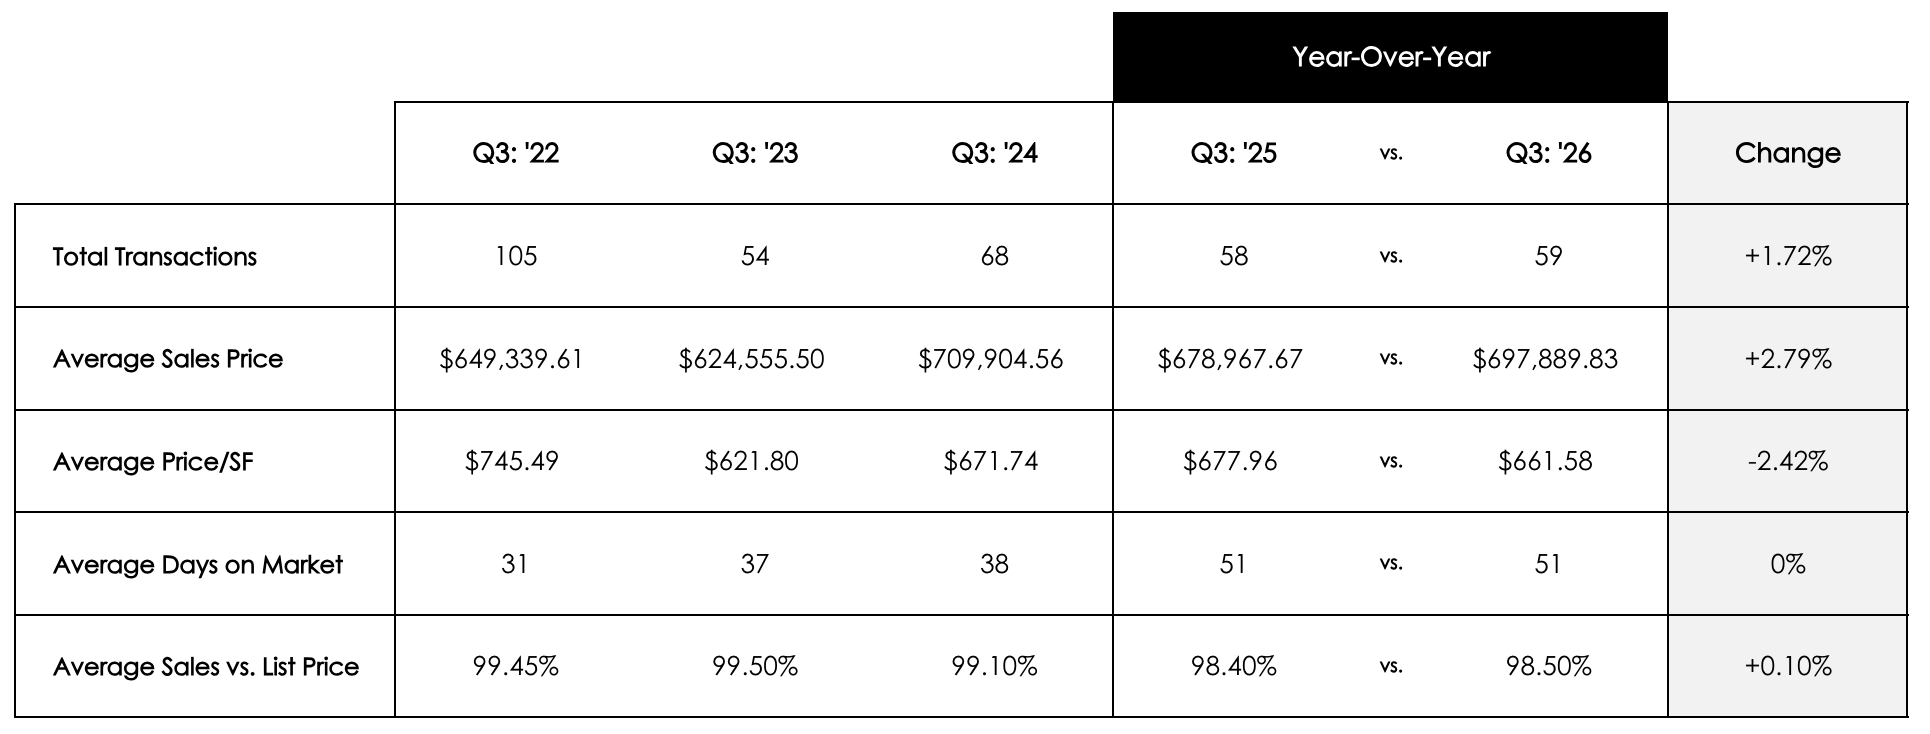
East Boston recorded 59 condominium transactions, nearly unchanged from the 58 sales completed in Q3 2025. Average sale prices increased 2.8% to approximately $698,000, while average price per square foot declined 2.4%. Marketing times remained steady at 51 days, and the average sale-to-list ratio was 98.5%. Overall, the neighborhood demonstrated relatively stable transaction activity with mixed pricing indicators.
Fenway/Kenmore
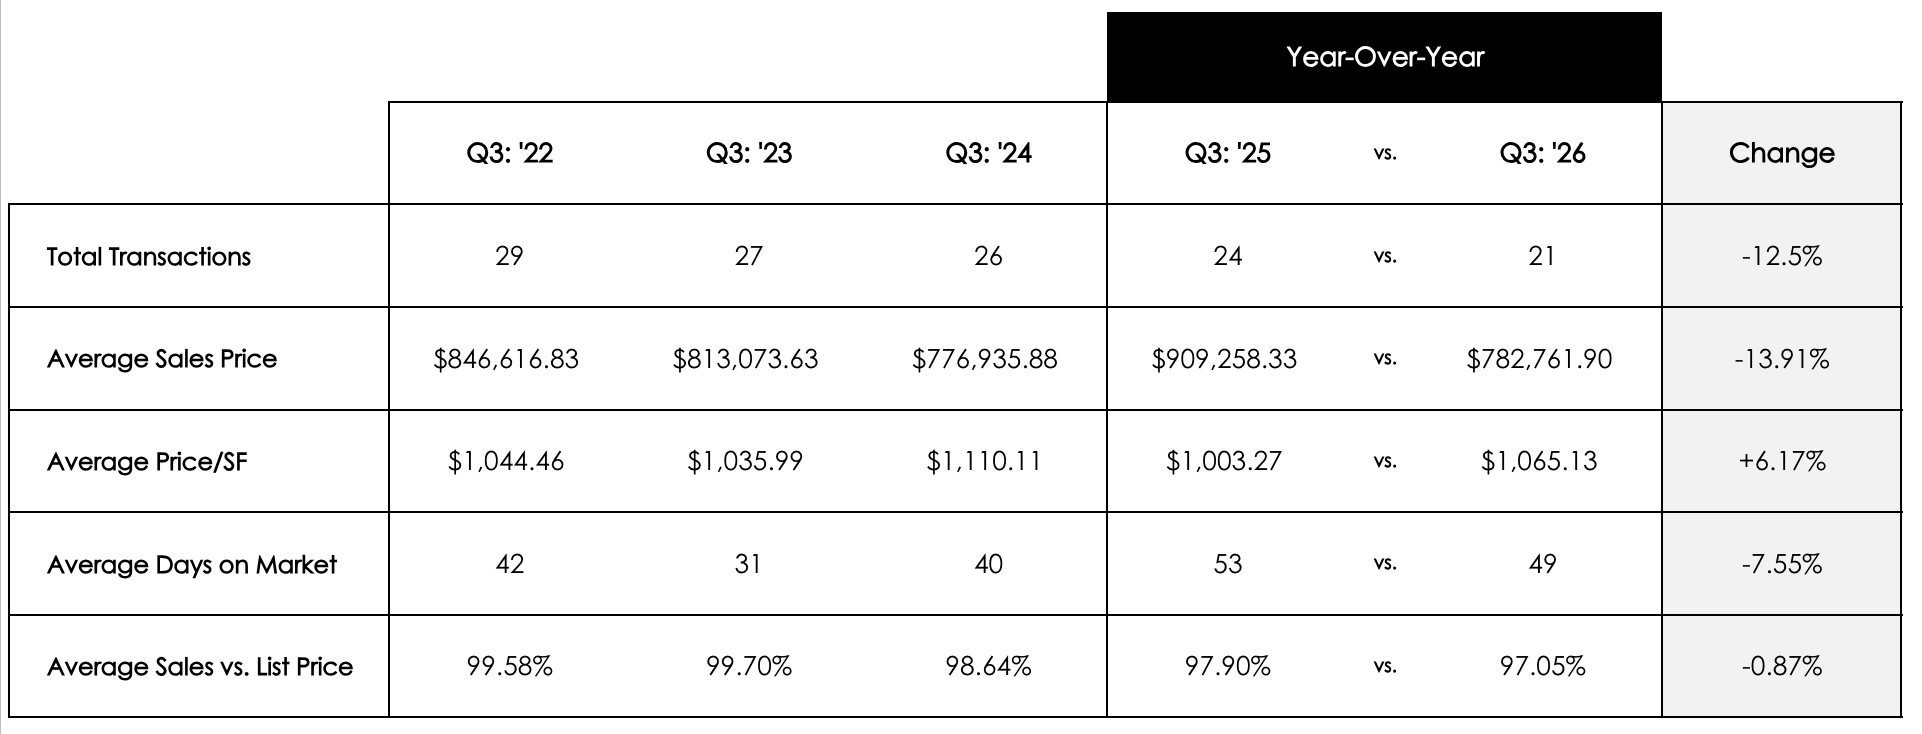
Fenway/Kenmore recorded 21 condominium sales, down from 24 a year earlier. The average sale price declined 13.9% to approximately $783,000, although price per square foot increased 6.2%. Properties spent an average of 49 days on the market, compared with 53 days in Q3 2025. The divergence between average sale prices and price per square foot suggests that differences in the size or composition of sold properties may have influenced the results.
Jamaica Plain
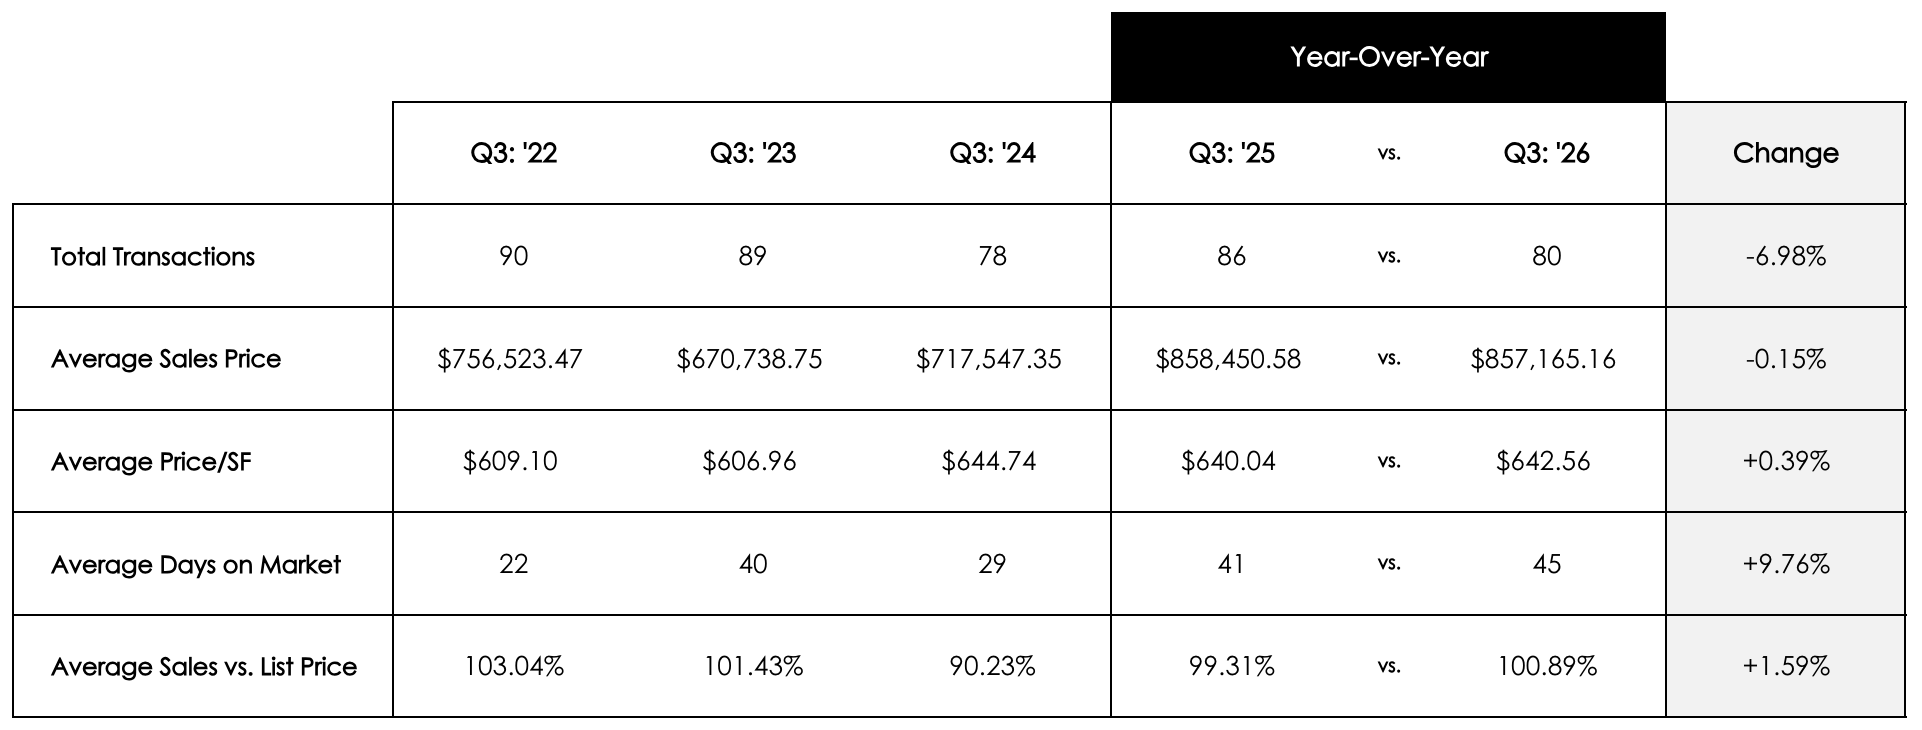
Jamaica Plain's condominium market remained relatively stable in Q3 2026. The average sale price was approximately $857,000, nearly unchanged from the previous year, while price per square foot increased slightly by 0.4%. Transaction volume declined from 86 to 80 sales, and average days on market increased from 41 to 45. Notably, properties sold at an average of 100.9% of asking price, indicating that competitive bidding continued for some properties.
Midtown
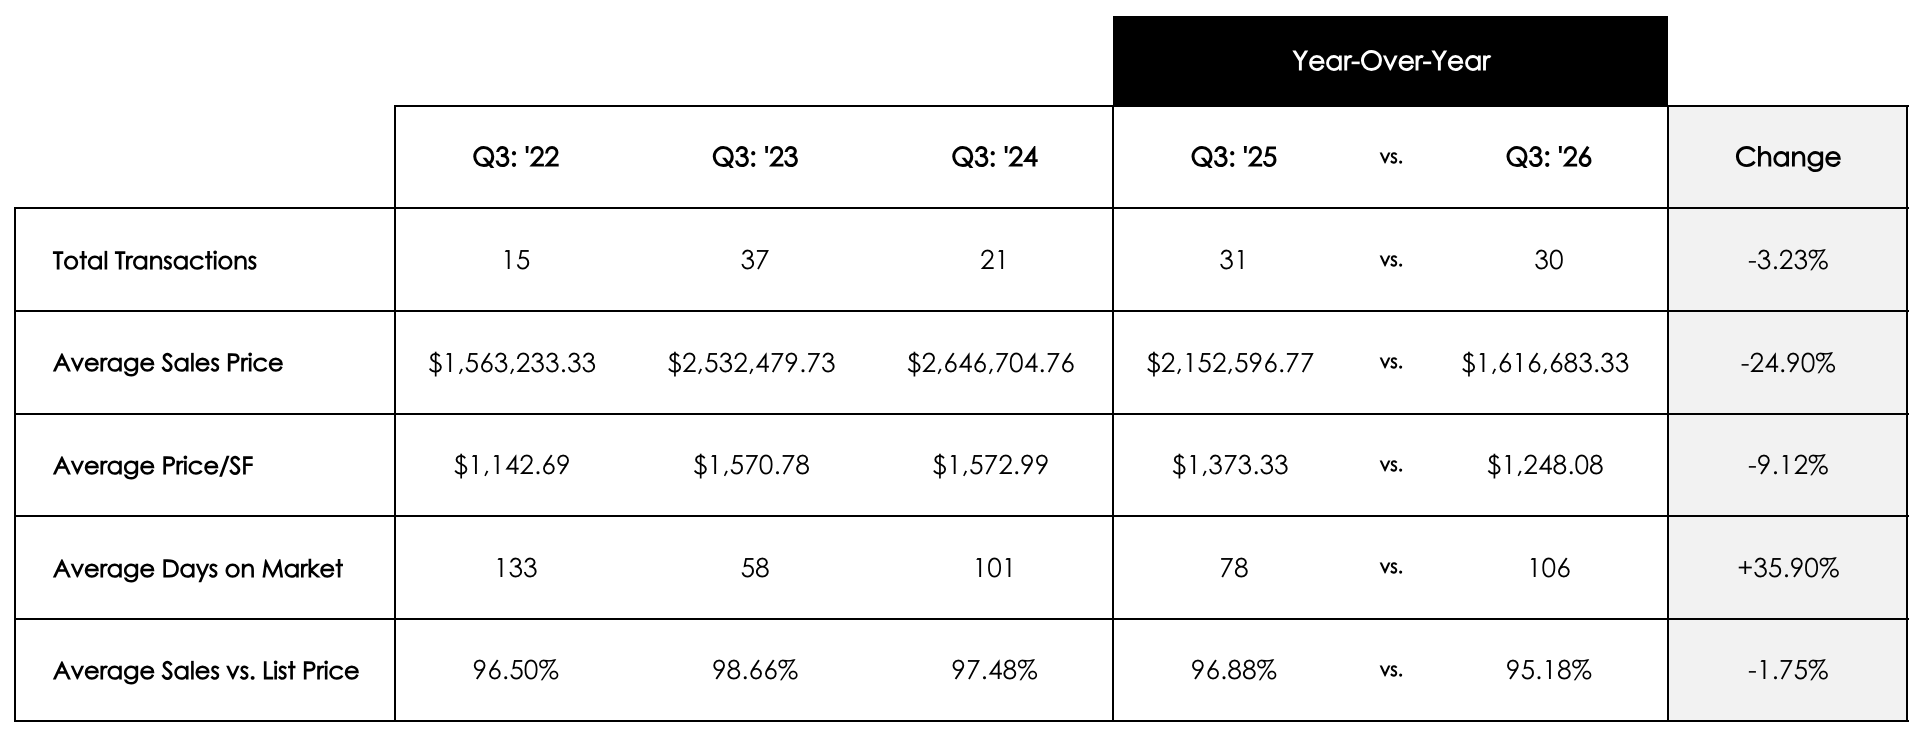
Midtown experienced a notable decline in average condominium pricing during Q3 2026. The average sale price decreased 24.9% to approximately $1.62 million, while price per square foot fell 9.1%. Transaction volume remained relatively stable at 30 sales, compared with 31 a year earlier. However, average days on market increased to 106, and properties sold at approximately 95.2% of asking price. The results indicate slower market conditions, although the mix of properties sold may have influenced the pricing changes.
Mission Hill
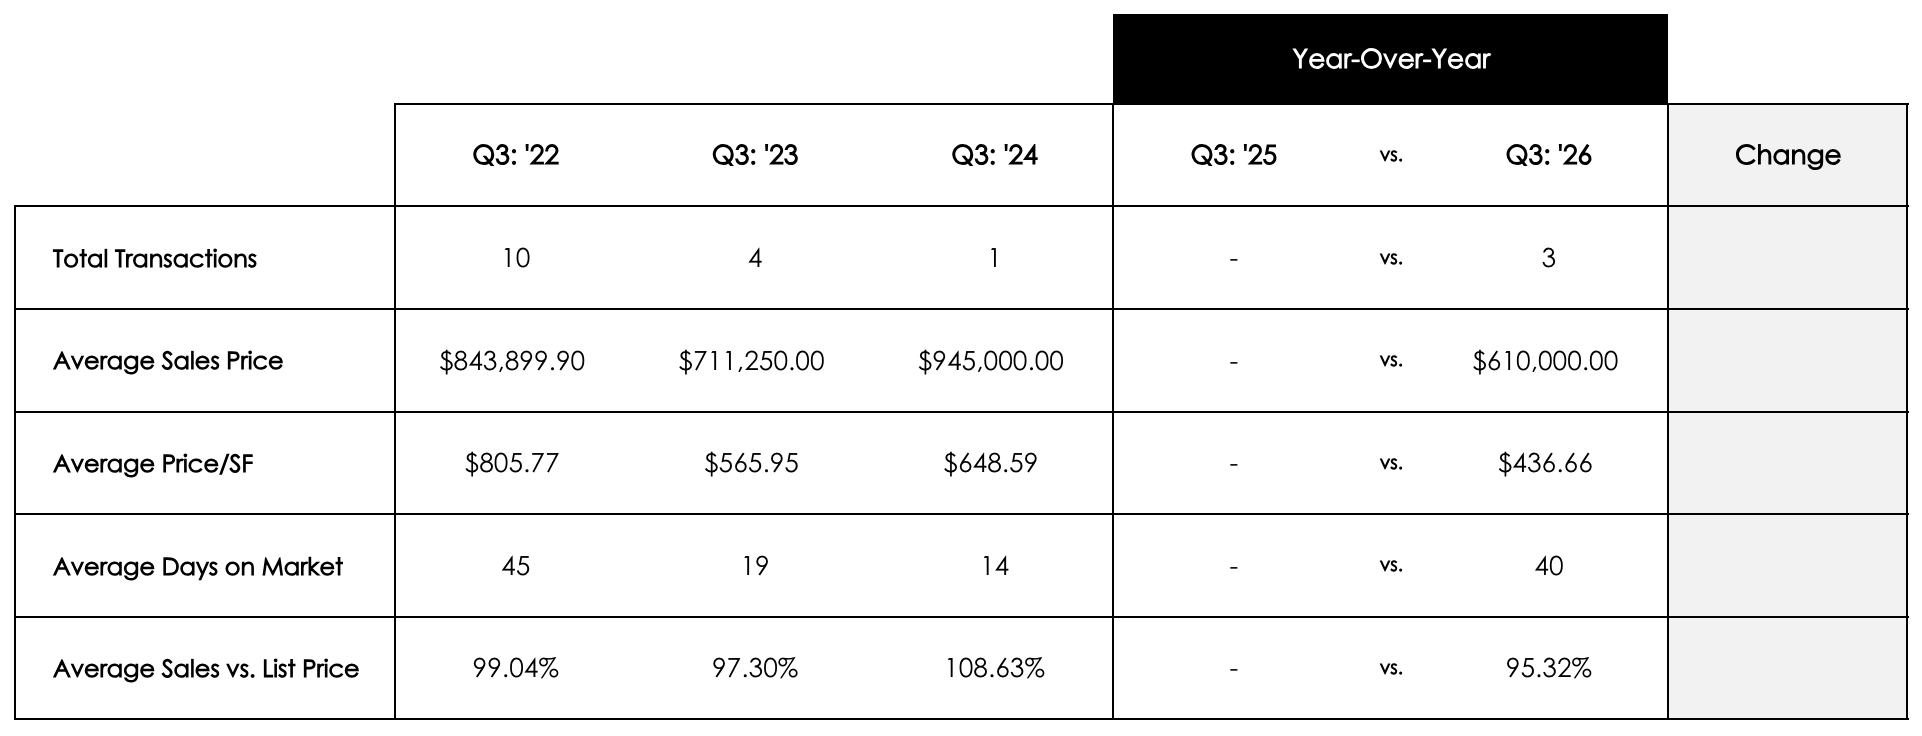
Mission Hill recorded three condominium transactions during Q3 2026, with an average sale price of $610,000 and average price per square foot of $436.66. Properties spent an average of 40 days on the market and sold at approximately 95.3% of asking price. Given the small number of transactions, the Q3 2026 figures should be interpreted with caution.
North End
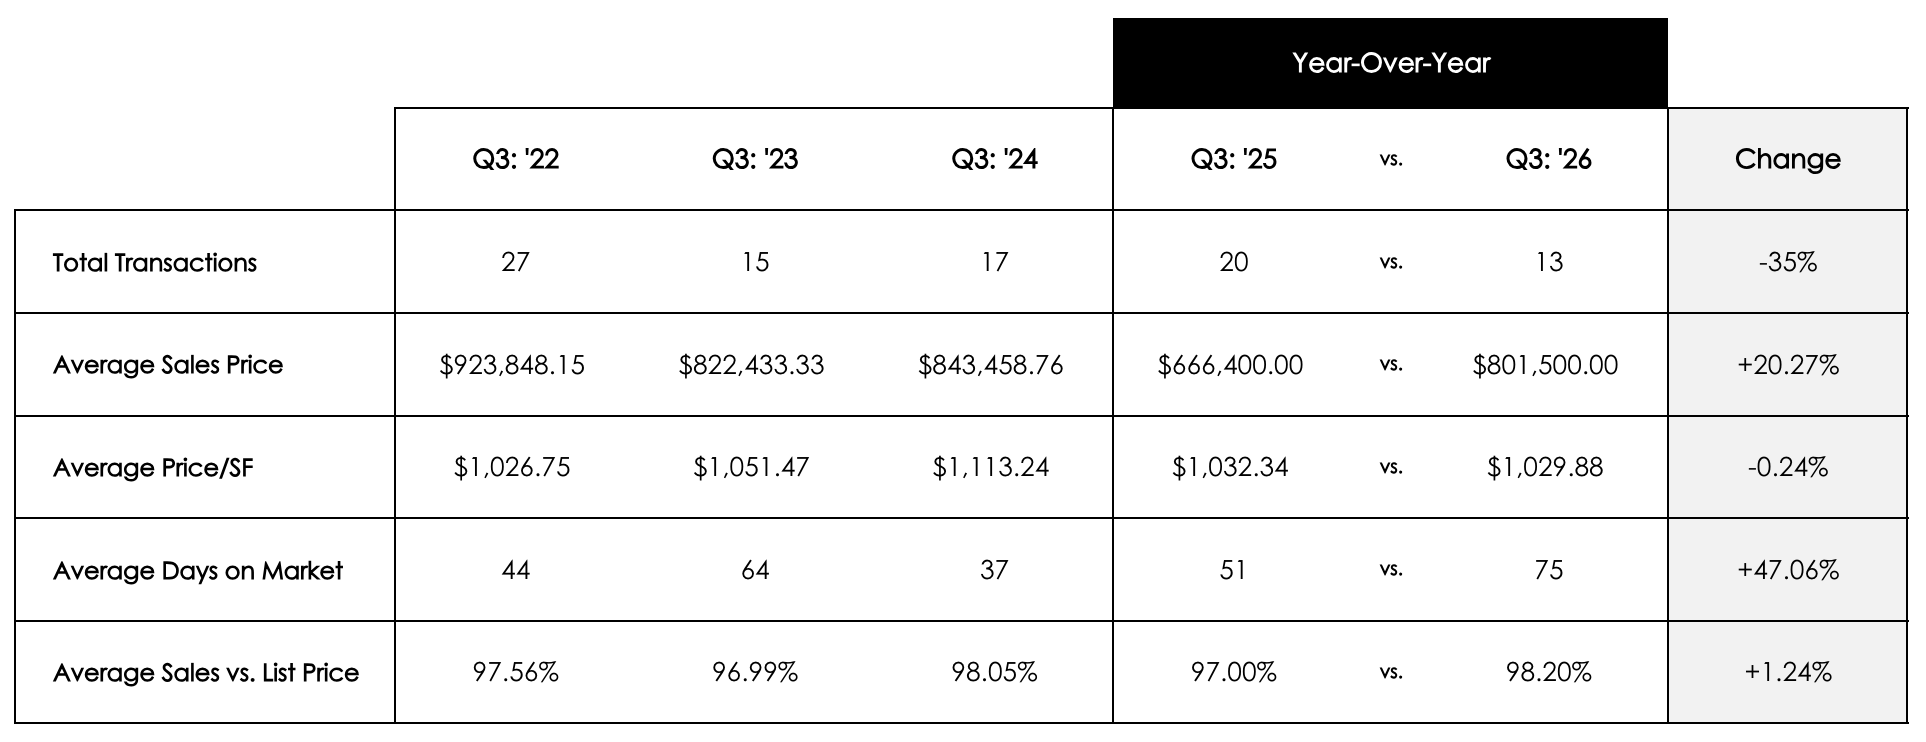
The North End recorded 13 condominium transactions during Q3 2026, down from 20 a year earlier. Average sale prices increased 20.3% to approximately $802,000, although price per square foot declined slightly by 0.2%. Average days on market increased from 51 to 75, while the sale-to-list ratio improved to 98.2%. These results suggest that the increase in average sale price may reflect the mix of properties sold rather than uniform price appreciation.
Roslindale
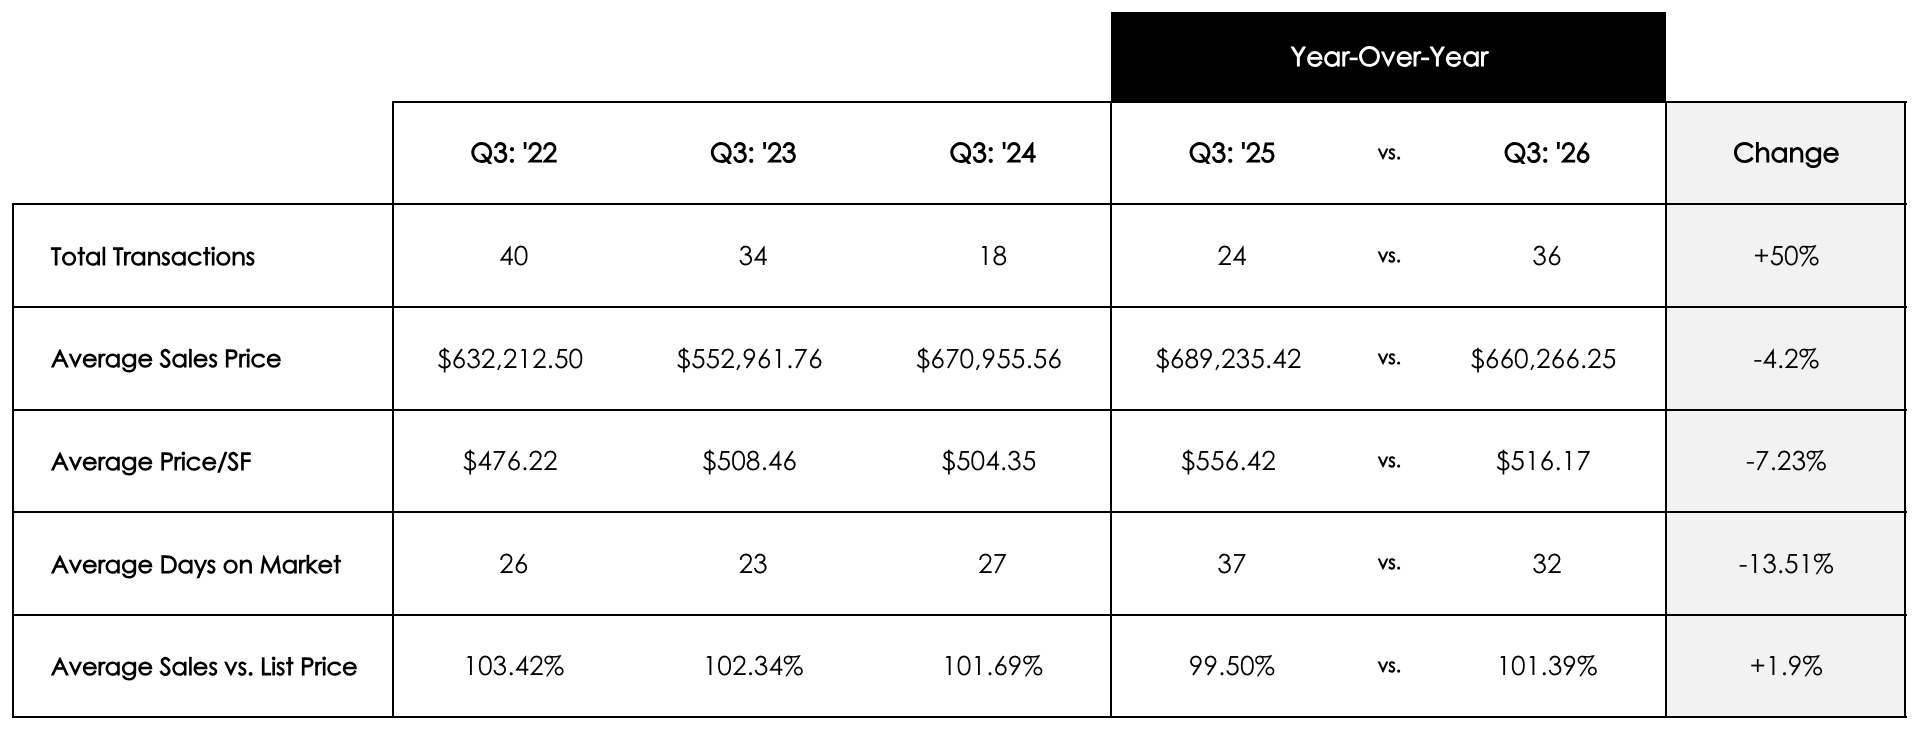
Roslindale experienced a substantial increase in transaction activity, with 36 condominium sales compared with 24 in Q3 2025. Average sale prices declined 4.2% to approximately $660,000, while price per square foot fell 7.2%. Despite these pricing declines, properties sold faster, with average marketing time decreasing to 32 days. The sale-to-list ratio reached 101.39%, indicating that completed sales achieved prices above asking on average.
Roxbury
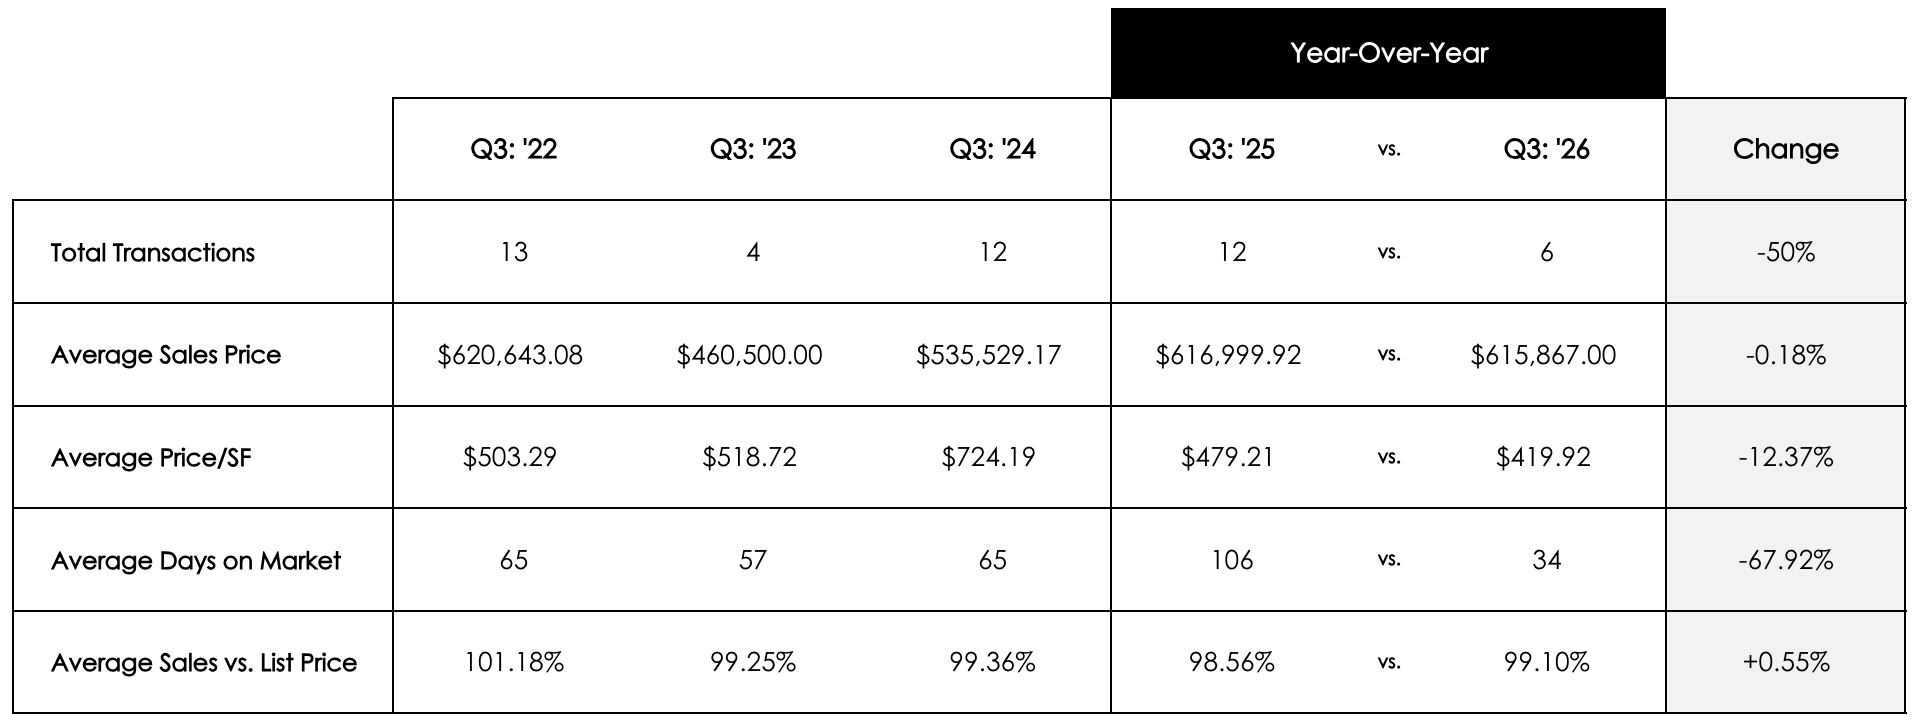
Roxbury recorded six condominium transactions during Q3 2026, compared with 12 a year earlier. The average sale price remained relatively stable at approximately $616,000, while price per square foot declined 12.4%. Average days on market fell significantly from 106 to 34, and properties sold at approximately 99.1% of asking price. With only six transactions, the results may be particularly sensitive to differences among individual properties.
Seaport
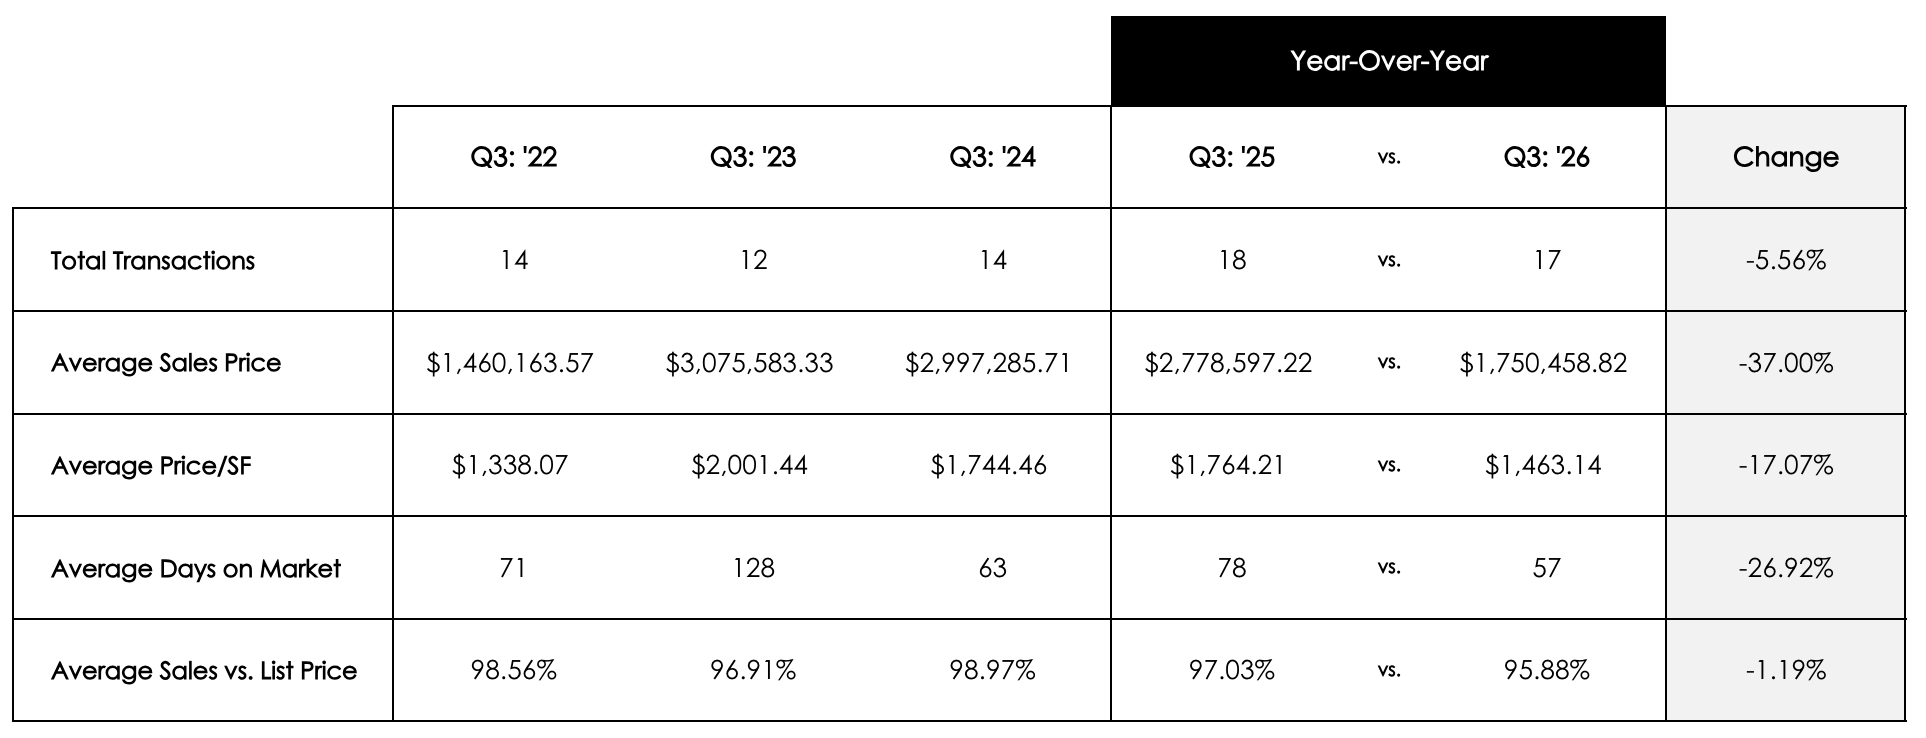
The Seaport experienced one of the largest declines in average condominium pricing during Q3 2026. The average sale price fell 37.0% to approximately $1.75 million, while price per square foot decreased 17.1%. Transaction volume remained relatively stable at 17 sales, compared with 18 in Q3 2025. Average marketing time improved from 78 to 57 days, although the sale-to-list ratio declined to 95.88%. Given the neighborhood's luxury inventory and relatively small number of sales, changes in the types and price points of units sold may have had a significant impact on the averages.
South Boston
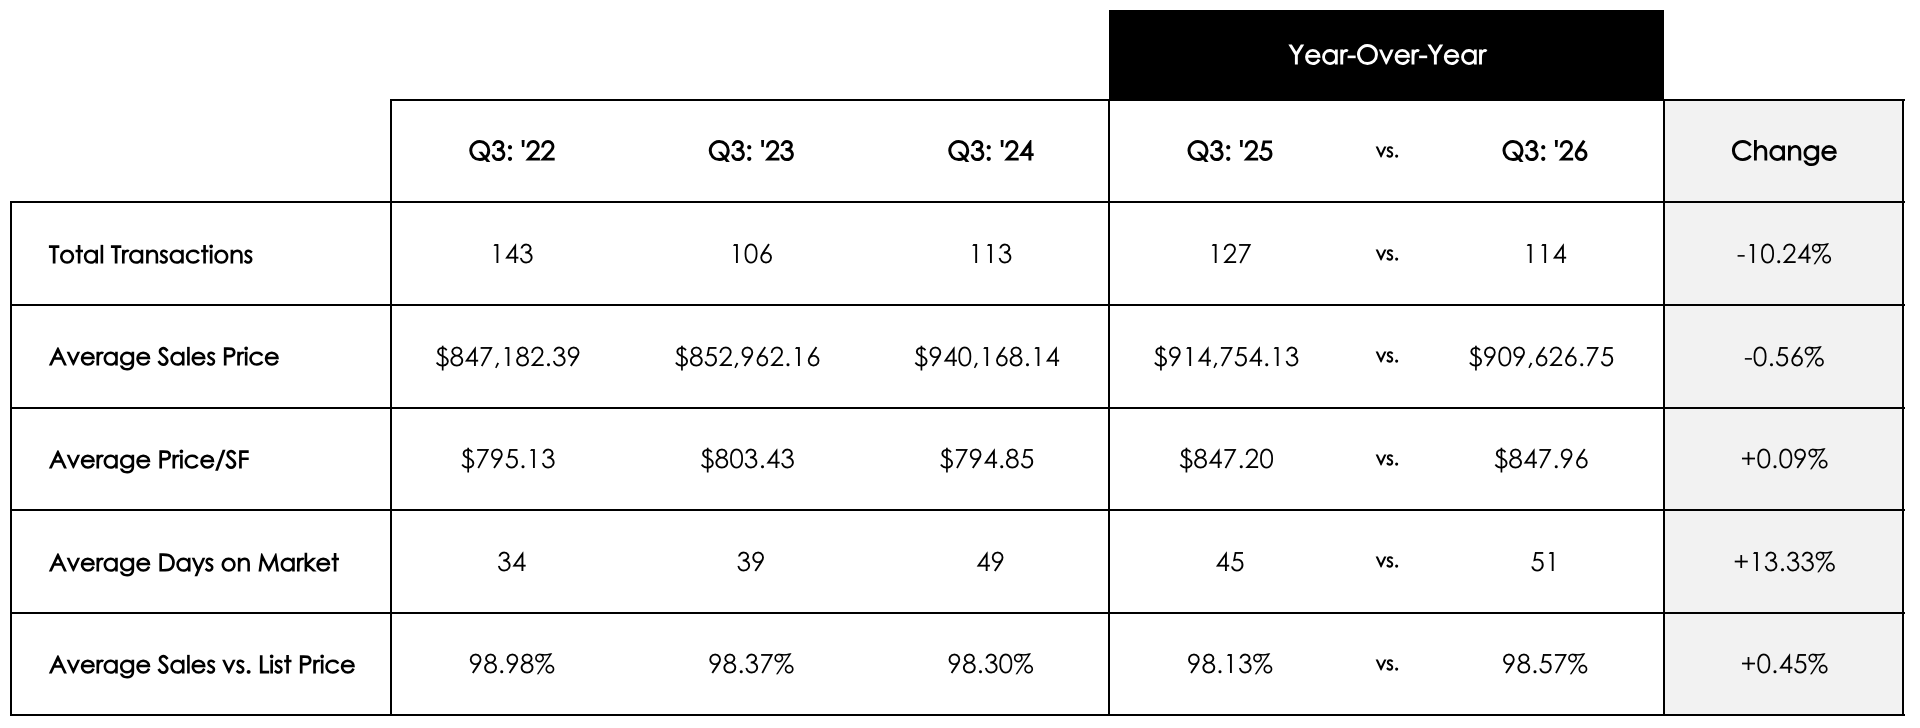
South Boston remained one of Boston's most active condominium markets, recording 114 transactions during Q3 2026. Sales volume declined 10.2% year over year, while the average sale price remained relatively stable at approximately $910,000. Average price per square foot increased slightly to $847.96, and marketing times rose from 45 to 51 days. The data suggests that South Boston maintained relatively consistent pricing despite slower transaction activity.
South End
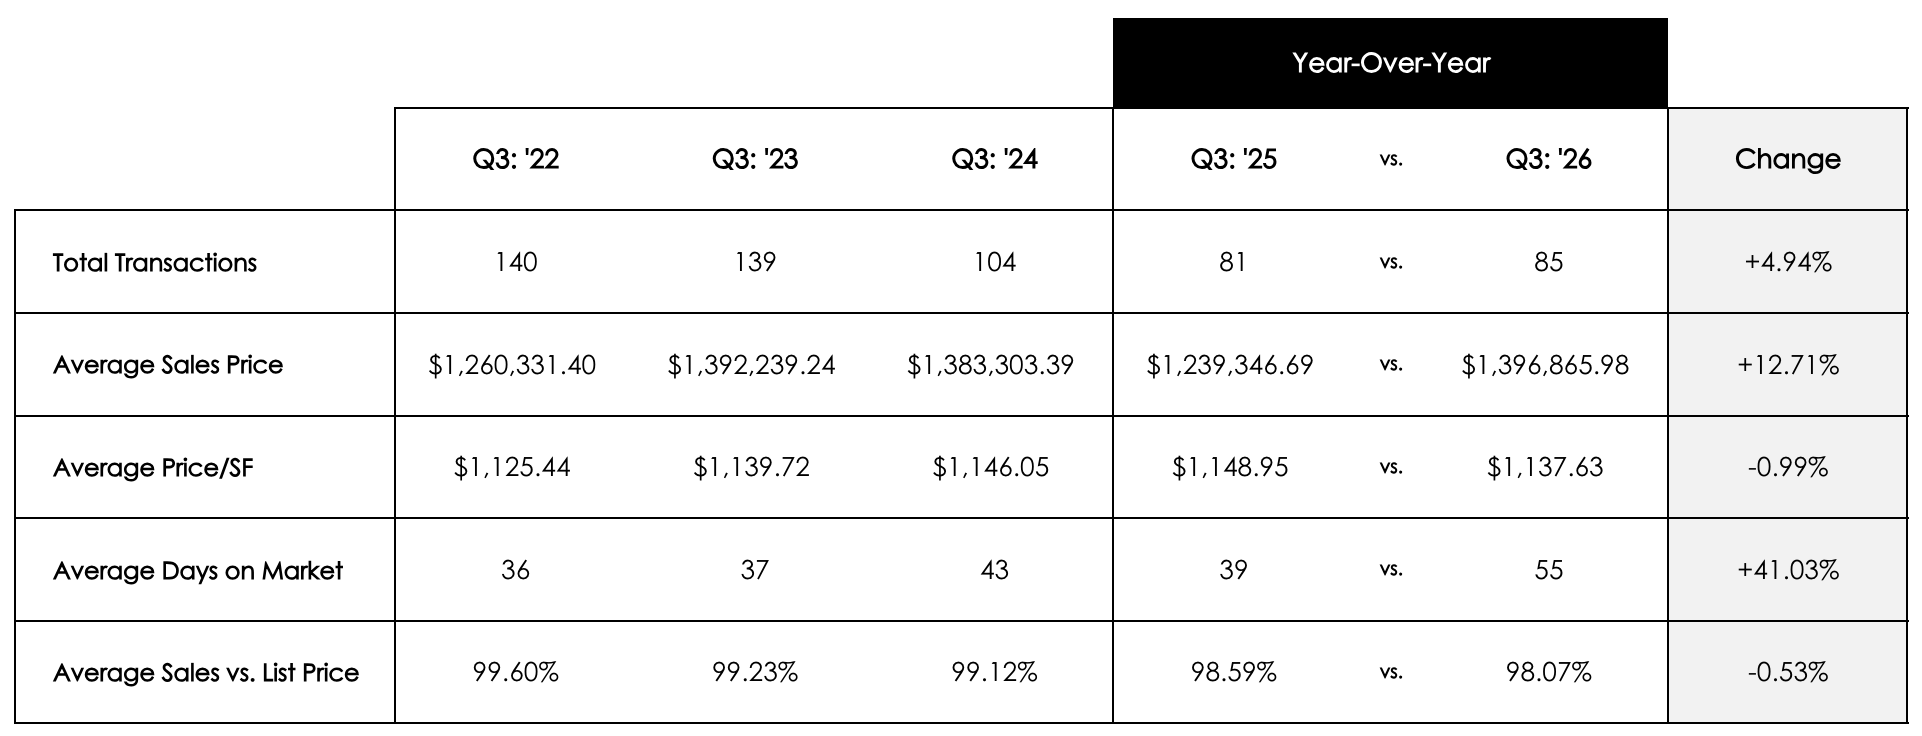
The South End recorded 85 condominium sales during Q3 2026, up from 81 in the prior year. Average sale prices increased 12.7% to approximately $1.40 million, although price per square foot declined 1.0%. Average marketing time increased from 39 to 55 days, and the sale-to-list ratio decreased slightly to 98.07%. The results suggest higher average transaction values, but the mixed pricing metrics and longer selling times point to a more nuanced market.
Waterfront
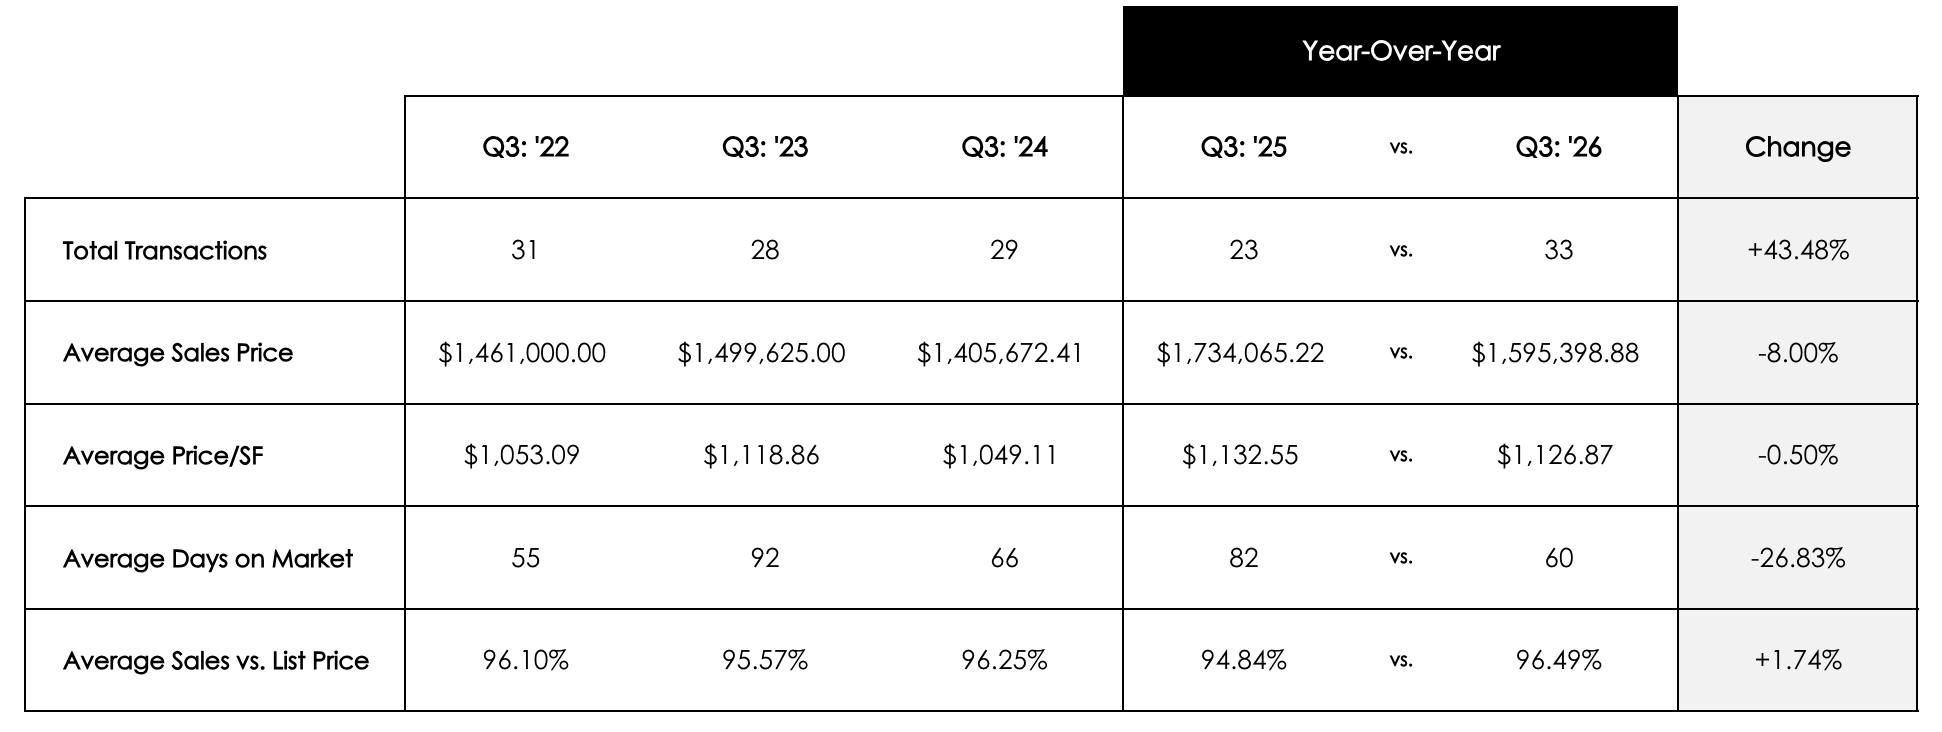
Boston's Waterfront recorded 33 condominium sales during Q3 2026, up from 23 a year earlier. The average sale price declined 8.0% to approximately $1.60 million, while price per square foot remained relatively stable, decreasing 0.5%. Average days on market improved from 82 to 60, and the sale-to-list ratio rose to 96.49%. Increased transaction activity and faster sales suggest improving market momentum despite lower average sale prices.
West End
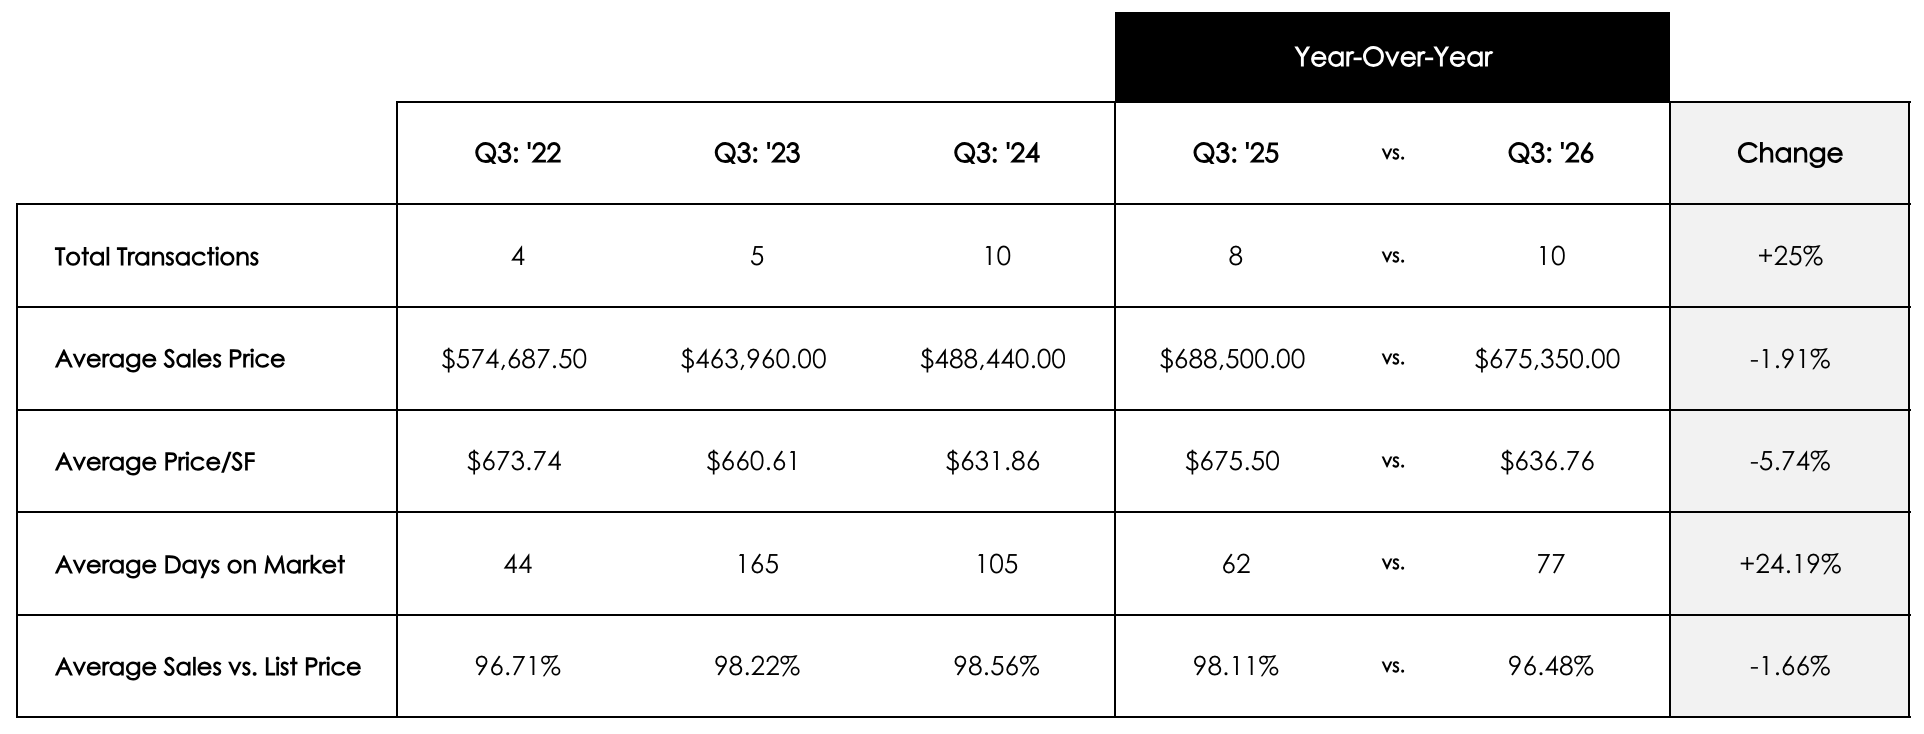
The West End recorded 10 condominium transactions during Q3 2026, compared with eight in the prior year. Average sale prices declined 1.9% to approximately $675,000, while price per square foot fell 5.7%. Average marketing time increased from 62 to 77 days, and the sale-to-list ratio declined to 96.48%. The results suggest softer pricing and longer selling times, although the small transaction count limits broader conclusions.
West Roxbury
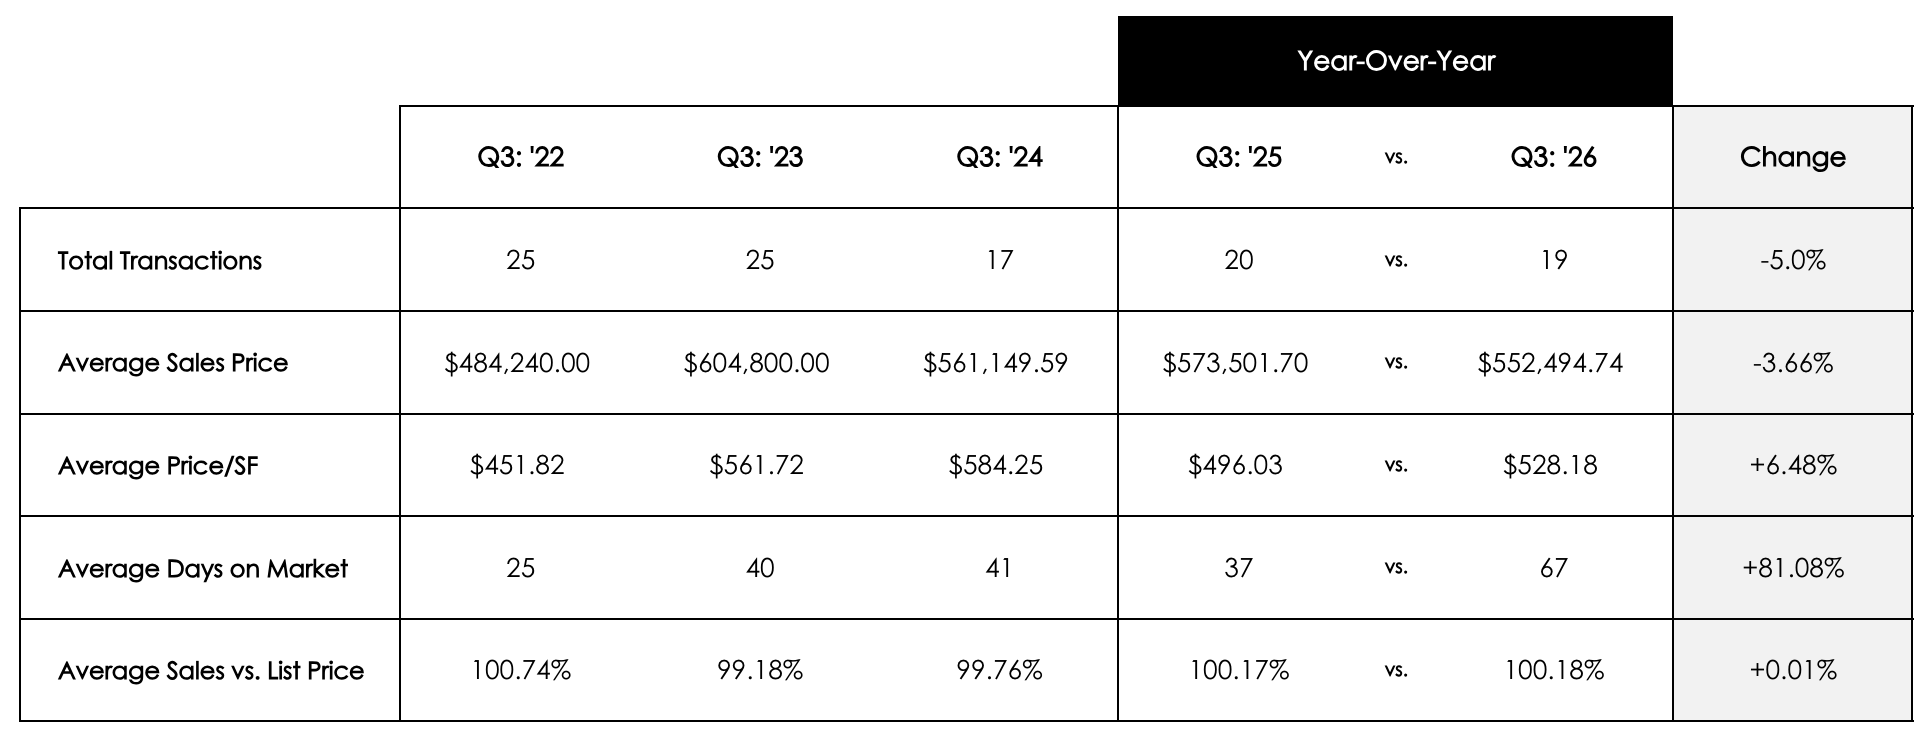
West Roxbury recorded 19 condominium transactions during Q3 2026, compared with 20 a year earlier. Average sale prices declined 3.7% to approximately $552,000, while price per square foot increased 6.5%. Average marketing time rose substantially from 37 to 67 days. Properties nevertheless sold at approximately 100.2% of asking price, suggesting that well-positioned listings could still attract competitive offers despite longer marketing periods.
Overall market takeaways
The Q3 2026 data highlights a Boston condominium market characterized by pricing resilience, selective buyer demand, and meaningful differences between neighborhoods.
While average sale prices increased citywide, transaction volume continued its gradual five-year decline and properties took longer to sell. This combination suggests that buyers remained active but were increasingly selective about pricing, property condition, and overall value.
Three trends stand out:
1. Higher prices did not always mean stronger seller leverage. Beacon Hill and the South End experienced substantial increases in average sale prices, yet both also recorded longer marketing times. This reinforces the importance of distinguishing between higher-value transactions and broader market competitiveness.
2. Several neighborhoods demonstrated more balanced performance. Charlestown and Dorchester combined higher prices per square foot with relatively stable or improving marketing times and strong sale-to-list ratios. These indicators suggest comparatively healthy demand.
3. The luxury market showed considerable variation. Back Bay maintained relatively stable activity and higher average prices, while the Seaport and Downtown experienced notable declines in average transaction values. Differences in the properties sold may explain part of these changes, particularly in neighborhoods with limited sales volume.
What this means for sellers
Boston condominium values remained resilient overall, but the market continued to reward thoughtful pricing and preparation. With average marketing times increasing, sellers should evaluate recent comparable sales, competing inventory, and property-specific characteristics rather than relying solely on broader neighborhood price trends.
What this means for buyers
Longer marketing times and average sale-to-list ratios below 100% in many neighborhoods suggest that buyers may have opportunities to negotiate. However, conditions vary considerably by location, and some neighborhoods continue to see properties selling at or above asking price.
Conclusion
Boston's condominium market entered the final quarter of 2026 with encouraging pricing fundamentals, despite modestly lower transaction activity and longer selling times.
The neighborhood-level data demonstrates that there is no single market experience across Boston. Some areas are experiencing stronger pricing, others are seeing faster sales, and several are showing signs of increased buyer negotiating power.
For buyers and sellers alike, understanding these local differences is essential to making informed real estate decisions.
At The Charles Realty, our experience across Boston's neighborhoods allows us to provide property-specific guidance informed by local market conditions.
Thinking about buying or selling in Boston? Connect with The Charles Realty for a personalized market analysis and guidance on your next move.
*Data Source: MLSPIN as of 10/1/2026

Social Links Footer